Manoj Madusanka
Dear Investors,
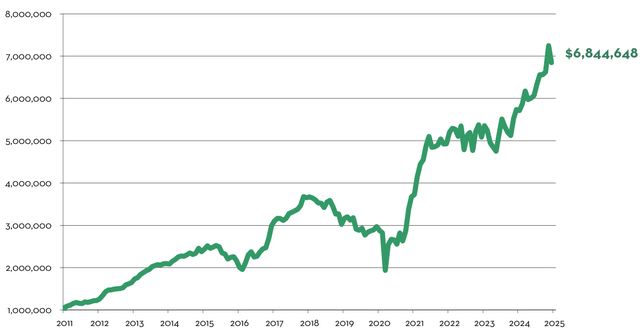
The Portfolio* appreciated +19.3% (net of fees) in 2024.
Since inception, Marram has generated +584.5% cumulative return and +14.7% annualized return, net of fees.
For monthly details, see Historical Performance Returns* at the end of this letter. Also, please refer to your separate account statement for exact account return figures.
$1,000,000 Investment in Marram (Net Return, Inception 1/1/2011 to 12/31/2024)*
ABOUT MARRAM
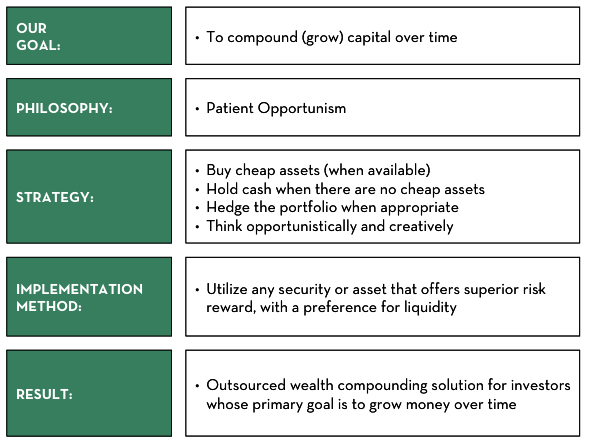
Marram is an outsourced long-term investment solution, focused on growing wealth for retirement or legacy purposes. We began as a service for a small circle of friends and family. Our investor-friendly fee structure (lower than hedge funds), terms (separate accounts, no lock-up), and high standards of care and excellence, reflect those origins. Our portfolio manager has the majority of her family’s liquid net worth invested in the same strategy – we eat our own cooking – ensuring that we shepherd your investment with the utmost care, as we would our own.
PORTFOLIO ALLOCATIONS
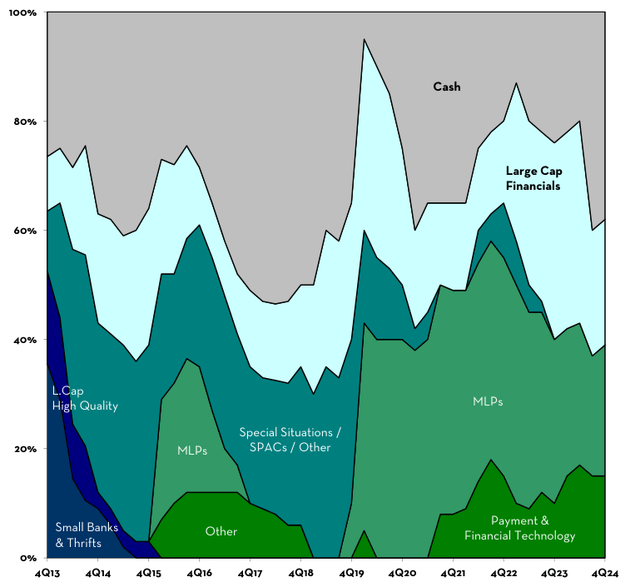
Below is the target portfolio allocation – the optimal allocation as of the writing of this letter. Investor separate accounts may differ from this allocation due to changes in asset prices, availability to acquire/divest securities in the marketplace, margin & trading capabilities, and tax considerations.
Over time, all investor separate accounts converge upon the target portfolio allocation.
Large-Cap Financials: 23% NAV
In March 2023, the U.S. banking system experienced a brief crisis when three banks failed in quick succession. The prices of large regional banks fell precipitously as investors indiscriminately sold shares, allowing us to significantly increase our exposure at fire-sale prices. At the time, market sentiment did not distinguish between Held To Maturity (“HTM”) vs. Available For Sale (“AFS”) securities unrealized losses, which presented us with a unique opportunity. While other market participants viewed the AFS unrealized losses as an undesirable risk, we viewed them as a juicy source of future upside as the losses naturally reverse with time. We were correct. These investments have increased significantly in value since then. Taking into account recent price appreciation, we estimate this basket (through the combination of AFS unrealized loss reversals, profitable earnings yields, and valuation multiple expansion) will generate ~1.5X in the next 3 years. See our 2023 1 st Quarter Letter for our Regional Bank investment thesis.
Energy Infrastructure / Master Limited Partnerships (MLPs): 24% NAV
Energy infrastructure companies with assets indispensable to the smooth function of modern society. These investments were made in early 2020, taking advantage of commodity price volatility, shareholder turnover, forced selling, and uncertainty related to the long-term demand of fossil fuels which drove prices to extremely low levels. Since then, geopolitical strife, inflation, and increased recognition of the limitations of renewable energy have led market participants to reembrace fossil fuels, which in turn has lifted the prices of our MLPs. The size of this allocation peaked at 42% of NAV in late-2021, and has gradually declined due to harvested gains, trimmed exposures, and M&A activity. MLPs remain a cornerstone of our portfolio given favorable industry demand dynamics, stable cash flows, conservative balance sheets, reasonable valuations (at ~10x Cash Flow), and generous cash distributions. See our 2019 4 th Quarter and 2021 2 nd Quarter Letters for our MLP investment thesis.
Reinvestment Growth (Payments & Financial Technology): 15% NAV
Fast-growing payments & financial technology businesses with favorable revenue tail winds, operating in areas with vast untapped total addressable markets, generating cash profits, actively reinvesting profits back into the business at high incremental margins, and self-funding future growth with little/no equity dilution. We purchased these investments at attractive prices that will generate at least 3X return in 5 years based on reasonable topline growth & margin assumptions. This allocation will increase in size over time as market volatility presents us with buying opportunities. See our 2022 1st Quarter Letter for more details.
Cash & Cash Equivalents: 38% NAV
This category will fluctuate depending on investment opportunities available in the marketplace. We collect ~4% interest and dividends per year which continuously replenishes our cash balance.
Target Portfolio Allocation % Over Time
PORTFOLIO RETURN* ANALYSIS & FUTURE POSITIONING
2024 was yet another lucrative return year. The portfolio* appreciated 4.4% (net) in the 4 th quarter, bringing our 2024 total return to +19.3% (net).
Our investments in Energy Infrastructure MLPs, Large-Cap Financials, and Payment Technology contributed 39.5%, 39.3%, and 14.4% of total $ gains, respectively.
There have been no materials changes to the portfolio since our last quarterly update.
The abundance of observable speculative behavior in the marketplace leaves us in little doubt that future opportunities are on the near horizon. In preparation, we are diligently refreshing our knowledge of familiar sectors (financials, energy, payment technology, and real estate) and expanding our knowledge of new adjacent sectors (software & hardware technology, utilities, renewables, and petrochemicals).
Because Marram does not actively fundraise, we spend the majority of our time on investment research: sourcing information via SEC filings, earnings reports, presentations, management interviews, trade publications, etc. and voraciously reading books across a wide range of subjects and genres. The latter is a trait common to many great investors because books help place business facts and figures into proper historical, present, and future context, aiding in the potential discovery of variant perceptions not yet observed by other market participants.
Combining a deep well of existing expertise, persistent search for new knowledge, and balanced mental equanimity, we are ready to capitalize on future opportunities, whenever and wherever they emerge.
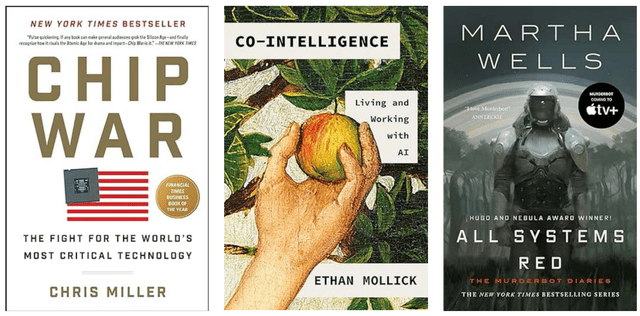
Marram Book Club
If you would like to better understand the current speculative rage and geopolitical tensions related to semiconductor chips and artificial intelligence, we highly recommend the following books for historical, present, and future context. Happy reading!
Please do not hesitate to reach out with any questions. As always, thank you for your trust. We look forward to continuing our capital compounding adventures in the years ahead.
Yours very truly,
Vivian Y. Chen, CFA
Portfolio Manager, Marram Investment Management
APPENDIX: HISTORICAL PERFORMANCE RETURNS (NET OF FEES)*
|
Calendar Year |
Marram (Net of Fees) |
S&P 500 (Total Return) |
% Difference |
|
2011 |
22.3% |
2.1% |
+20.2% |
|
2012 |
34.7% |
16.0% |
+18.7% |
|
2013 |
27.3% |
32.4% |
-5.1% |
|
2014 |
13.3% |
13.7% |
-0.4% |
|
2015 |
-9.1% |
1.4% |
-10.5% |
|
2016 |
38.5% |
12.0% |
+26.6% |
|
2017 |
22.1% |
21.8% |
+0.3% |
|
2018 |
-17.3% |
-4.4% |
-12.9% |
|
2019 |
-1.7% |
31.5% |
-33.2% |
|
2020 |
23.7% |
18.4% |
+5.3% |
|
2021 |
34.0% |
28.7% |
+5.3% |
|
2022 |
3.2% |
-18.1% |
+21.3% |
|
2023 |
12.9% |
26.3% |
-13.4% |
|
2024 |
19.3% |
25.0% |
-5.7% |
|
Cumulative Return % |
584.5% |
510.7% |
+73.8% |
|
Annualized Return % |
14.7% |
13.8% |
+0.9% |
|
* Unaudited, net return figure calculation assumes 2% per annum management fee, pro-rated and deducted monthly from performance of the portfolio manager’s taxable separate account which does not pay management or performance fees. This separate account most accurately reflects the long-term investment strategy of Marram Investment Management. Remaining separate accounts were purposefully omitted as they may deviate from the strategy due to fee structure, custodial & trading expenses, fund transfer & order timing, margin & trading capabilities, tax considerations, and other account restrictions. Returns for each separate account may differ. Please refer to your account statements for actual net return figures. Returns presented for S&P 500 include dividend reinvestment. While the S&P 500 is a well-known and widely recognized index, the index has not been selected to represent an appropriate benchmark for Marram’s investment strategy whose holdings, performance and volatility may differ significantly from the securities that comprise the index. Investors cannot invest directly in an index (although one can invest in an index fund designed to closely track such index). Historical performance is not indicative of future results. An investment is speculative and involves a high degree of risk and possible loss of principal capital. All information presented herein is for informational purposes only. No investor or prospective investor should assume that any such discussion serves as the receipt of personalized advice from Marram. Investors are urged to consult a professional advisor regarding the possible economic, tax, legal or other consequences of entering into any investments or transactions described herein. A list of all recommendations made by Marram within the immediately preceding period of not less than one year is available upon request. It should not be assumed that recommendations made in the future will be profitable or will equal the performance of the securities on this list. Specific companies or securities shown are meant to demonstrate Marram’s investment style and the types of companies, industries, and instruments in which we invest, and are not selected based on past performance. The analyses and conclusions include certain statements, assumptions, estimates and projections that reflect various assumptions by Marram concerning anticipated results that are inherently subject to significant economic, competitive, and other uncertainties and contingencies, and have been included solely for illustrative purposes. No representations, express or implied, are made as to the accuracy or completeness of such statements, assumptions, estimates or projections, or with respect to any other materials herein. |
Original Post
Editor’s Note: The summary bullets for this article were chosen by Seeking Alpha editors.
#Marram #Investment #Management #Investor #Letter