Editor’s note: Seeking Alpha is proud to welcome Hirschmann Capital as a new contributing analyst. You can become one too! Share your best investment idea by submitting your article for review to our editors. Get published, earn money, and unlock exclusive SA Premium access. Click here to find out more »
Nikada
Dear Partner,
Below are updated results for the Hirschmann Partnership (the “Fund”). In H2 2024, the Fund returned 19.2% v. 8.4% for the S&P 500.
|
Class A Return |
Class B Return |
S&P 500 Index |
MSCI World Index |
Gold Miner Index |
Junior Gold Miner Index |
Gold (US$) |
|
|
Q4 2014 |
-2.2% |
-2.2% |
4.9% |
1.0% |
-13.3% |
-28.0% |
-2.2% |
|
2015 |
27.0% |
24.8% |
1.4% |
-0.5% |
-24.8% |
-19.2% |
-10.4% |
|
2016 |
47.1% |
44.7% |
12.0% |
7.9% |
54.3% |
75.1% |
9.1% |
|
2017 |
-12.6% |
-12.6% |
21.8% |
22.8% |
12.2% |
6.2% |
12.6% |
|
2018 |
-23.0% |
-23.0% |
-4.4% |
-8.4% |
-8.5% |
-11.3% |
-1.5% |
|
2019 |
63.3% |
63.3% |
31.5% |
28.1% |
40.4% |
42.2% |
18.3% |
|
2020 |
52.1% |
64.4% |
18.4% |
16.3% |
23.7% |
30.9% |
25.1% |
|
2021 |
-23.7% |
-23.7% |
28.7% |
22.2% |
-9.4% |
-21.0% |
-3.6% |
|
2022 |
-53.0% |
-53.0% |
-18.1% |
-17.9% |
-8.6% |
-14.3% |
-1.2% |
|
2023 |
42.6% |
42.6% |
26.3% |
24.2% |
10.6% |
8.6% |
14.1% |
|
2024 |
61.8% |
61.8% |
25.0% |
19.0% |
10.6% |
15.7% |
27.2% |
|
YTD 2025 |
22.1% |
22.1% |
2.8% |
3.6% |
14.9% |
13.6% |
6.6% |
|
Cumulative |
208.7% |
222.7% |
269.5% |
179.3% |
109.0% |
72.8% |
131.1% |
|
Annualized |
11.5% |
12.0% |
13.5% |
10.4% |
7.4% |
5.4% |
8.4% |
| MSCI Index is Developed Market Standard (Net w . USA Gross). Gold Miner Index is NYSE Arca. Junior Gold Miner Index is MVIS Global. As of Jan. 31 |
The US superbubble should burst soon:
- Investor euphoria is extreme. In Q4, US equities reached their highest-ever valuations on nearly all reliable metrics. 1 In November, US junk bond spreads were only ~20bps from their all-time low on the eve of the 2007-08 financial crisis. 2
- True to his mantra of being fearful when others are greedy, in Q3, Warren Buffett increased his cash allocation to an all-time high as investors decreased their cash allocation to an all-time low. 3
- This month, the 30-year TIPS yield reached its highest level since 2003 (excluding a two-month blip in 2008). 4 I have often warned that US government debt is at levels that have nearly always led to default (see 2020 and 2023 letters). Surging yields are precisely how a debt crisis might begin.
- In H2, the unemployment rate spiked, 5 full-time employment declined, 6 and the yield curve uninverted. Those signals accompanied 7 of the last 7 US recessions with no false positives. As I previously wrote, a recession should trigger a US government debt crisis.
- Seven of the world’s ten largest real estate markets are very overvalued if not bubbles. 7 It would be eight of ten if Germany’s real estate market had not recently crashed due to higher interest rates. Higher bond yields mean the remaining seven (US, China, Japan, India, UK, France, and Canada) may soon follow, torpedoing global wealth.
After an update on our gold mining equities (GMEs), I discuss why Toronto Stock Exchange gold mine developers are an exceptional opportunity to profit from the looming crisis.
Portfolio Detail
The Fund’s portfolio is summarized below:
|
Portfolio Weight |
||||
|
Security |
Dec-24 |
Jun-24 |
H2 ’24 Return Contribution |
Price / Intrinsic Value |
|
GME C1 |
33.7% |
52.3% |
17.6% |
108.5% |
|
GME G2 |
10.7% |
11.5% |
0.8% |
33.3% |
|
GME C3 |
9.8% |
1.1% |
3.9% |
23.5% |
|
GME S |
7.9% |
4.6% |
4.3% |
1.7% |
|
GME F |
6.6% |
4.5% |
-1.2% |
5.6% |
|
GME E |
6.3% |
2.7% |
-2.8% |
2.7% |
|
GME U |
6.0% |
Not Held |
-0.8% |
22.2% |
|
GME N |
4.7% |
6.4% |
-1.1% |
10.9% |
|
GME Z |
3.1% |
Not Held |
-0.1% |
17.9% |
|
GME E2 |
2.4% |
Not Held |
0.1% |
13.3% |
|
GME X2 |
1.6% |
Not Held |
0.1% |
16.7% |
|
GME D2 |
1.5% |
1.6% |
0.0% |
16.9% |
|
GME C2 |
1.4% |
6.3% |
2.6% |
82.3% |
|
GME S2 |
1.2% |
Not Held |
0.0% |
12.9% |
|
GME G3 |
1.1% |
0.4% |
0.2% |
18.0% |
|
GME P |
1.1% |
Not Held |
-0.4% |
6.7% |
|
GME U2 |
0.9% |
Not Held |
0.0% |
24.8% |
|
GME O2 |
0.5% |
2.5% |
2.5% |
N/A |
|
GME A |
Sold |
6.3% |
-6.3% |
N/A |
|
Total GMEs |
100.4% |
100.2% |
19.2% |
|
|
Cash |
-0.4% |
-0.2% |
0.0% |
100.0% |
|
Total |
100.0% |
100.0% |
19.2% |
| Prices are as of Dec. 31. Returns exclude performance allocation. GMEs are listed by descending portfolio weight. |
GME C1 (“C1”) appreciated 42% 8 after announcing a favorable resource estimate for its new, high-margin deposit. Due to C1’s increased valuation and portfolio weight, I reduced the Fund’s C1 shares by 44% in H2.
GME C3 (“C3”) appreciated after gold production commenced at two of C3’s three deposits. C3 has no debt and is expected to increase gold production substantially over the next few years.
GME C2 (“C2”) appreciated after production started at its second gold project. Due to C2’s increased valuation, I reduced the Fund’s C2 shares by 81%.
GME O2 (“O2”) appreciated after it agreed to a takeover offer from a larger gold mining company. Although the takeover price was less than O2’s intrinsic value, 9 the Fund earned a ~50% cumulative return over ~2 years.
GME E (“E”) declined after a Q4 equity raise. As shown above, however, E’s valuation is extremely low. E should appreciate in 2025 when E announces a new gold resource estimate and production plan.
GME A (“A”) was written off by the Fund after the bankruptcy process rendered the shares worthless. The company could have avoided bankruptcy by hedging gold price risk with put options rather than forward contracts, which can become a large liability when gold prices rise. I will encourage our other GMEs to avoid the same mistake.
Developers
When gold prices increase, the value of a producing gold mine (“producer”) grows faster than the gold price because production costs are relatively fixed. For instance, if gold rises 10% and a mine has a 10% profit margin, its profits will double as costs stay the same.
A gold mine developer (“developer”) is not yet producing gold but plans to do so by building a mine. When gold rises, developers tend to appreciate more than producers because:
A developer’s construction costs add fixed costs that increase the sensitivity of a mine’s net present value to changes in gold prices. Developers usually issue equity to fund mine construction. As gold prices drive up share prices, developers can raise additional equity capital with less dilution.
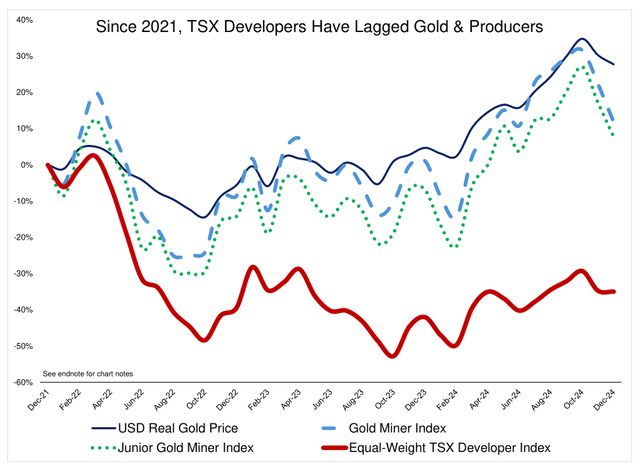
Hence, from 1979 to 1980, developers and other non-producing gold equities appreciated 2300%, far outstripping gold (161%) and producers (290%). 10 However, the chart below shows that, despite rising gold prices, Toronto Stock Exchange (TSX) developers have underperformed gold and producers since 2021. 11 This underperformance is almost certain to reverse.
Due to developers’ recent underperformance, many are trading at a fraction of intrinsic value. Examples include GMEs E, F, and S2 in the Portfolio Detail table above. The Fund has exited many past developer investments as they converged with intrinsic value (e.g., Atlantic Gold and Capricorn Metals). I expect similar or better results from our current holdings.
TSX developers also appear undervalued relative to producers and Australian Stock Exchange (‘ASX’) developers. TSX developers are trading at ~$25 per gold resource ounce. In comparison, the largest producers in the GDX, the main gold mining ETF, trade at ~$300 per ounce, 12 and ASX developers trade at ~$50 per ounce. 13
Bears’ concerns about developers seem overblown. Although production and construction costs have increased, gold prices have increased much more. 14 Although new mines have geological risk, that risk is diversifiable and diminishes as gold prices rise. Developers’ valuations are low even if dilution from future equity issuance is large.
Developers’ low valuations should cause producers to acquire more developers (e.g. the takeover of GME O2 at a ~60% premium in H2). Indeed, many developers are trading for much less than the cost to find and confirm new deposits through drilling (often more than $100/ounce). To paraphrase T. Boone Pickens, it is now far better to look for gold on the floor of the TSX than in the ground.
Developers have suffered as investors have chased the bubbles in US equities and cryptocurrencies. However, with those bubbles likely to burst soon and gold likely to soar in response, investor sentiment toward developers may soon change. Since developers’ total market capitalization (of less than $30bn) is tiny compared to US equities (~$60tn) and cryptocurrencies (~$4tn), small allocation shifts could cause developers to skyrocket.
Other
I continue to be the Fund’s second-largest investor and have most of my net worth invested in the Fund.
The Fund’s next letter is scheduled for mid-July. However, I expect to provide performance updates before then. Partners’ account statements will be uploaded shortly to the administrator’s portal.
In August, I was interviewed on the EisnerAmper Engaging Alternatives podcast. As of January 2025, the Fund had 30 clients (i.e., limited partners).
K-1s are scheduled for February. The Fund continues to focus on tax efficiency and has yet to incur any significant short-term capital gains. Unlike more than 99% of hedge funds, 15 the Fund has no non-deductible management fees.
I occasionally post comments relevant to the Fund on Twitter and, less frequently, on LinkedIn. We remain open to new investors, so feel free to distribute the redacted version of this letter.
The Fund’s most important competitive advantage will always be its patient clients, so I greatly appreciate your continued support.
Please contact me with any questions or comments.
Kind regards,
Brian Hirschmann, Managing Partner
|
Endnotes 1 Metrics that have been reliable predictors of future returns include price to sales, price to replacement cost( FAQ), price to gross value added, price to GDP, and price to cyclically adjusted earnings. See here for more about reliable valuation metrics. 2 Source: Federal Reserve. 3 See investor cash allocation in the second chart in this Economist article. 4 Source: Trading Economics 5 In H2, the Sahm rule was triggered. 6 A recession has always accompanied a decline in full-time employment as large as the Q4 decline. Source: Federal Reserve 7 This chart illustrates the US real estate bubble. China’s price-to-income ratio is ~30, compared to a normal ratio of ~3. India’s price-to-income ratio (~11) is also in bubble territory. The UK price-to-income ratio is ~7, far above its 20 th-century average. French home prices and price-to-income ratios are~60% above their 1965-2000 trend. Canada’s housing bubble makes the US bubble look modest. Japan’s price- to-rent ratio is similar to that of overvalued real estate markets in the US and Canada. 8 The share price change is expressed in local currency without any exchange rate adjustment 9 Intrinsic value is the estimated present value of a mine’s future gold revenue, at current gold prices, less all costs, discounted at 14%. 10 Other non-producing equities are explorers. Source: Gold.org and McEwen Mining (January 2025 presentation, pg. 7) 11 Gold Miner Index is the NYSE Arca Gold Miners Index. Junior Gold Miner Index is the MVIS Global Junior Gold Miners Index. The TSX developer index includes AOT, FF, FURY, GSHR, ITR, KORE, LGD, NEXG, OIII, PRB, SKE, SPA, STLR, TLG, VGZ and WM. Those companies operate in the US, Canada, and Australia. For the three companies that had large mergers during the period, the index measures their TSX share price change. For the rest, the index measures their change in market capitalization (to capture the effect of share issuance). First Mining Gold published a similar chart and deserves credit for the idea. Source: Koyfin 12 This is a capitalization-weighted average of Newmont, Agnico Eagle, and Barrick. Newmont’s copper resources are assigned zero value. 13 This is an equal-weight average of seven ASX-listed developers (AAR, AUC, AZY, HRN, KAI, MAU, and RXL) that operate in Australia. ASX developers have benefited from faster permitting and favorable currency trends. However, that does not explain TSX developers’ low valuation. The likely explanation is that TSX investors have been more distracted by the US equity bubble. Unsurprisingly, in recent years, ASX producers have acquired several TSX developers to arbitrage the valuation difference. 14 This is shown in the chart by the increase in the “Real Gold Price,” which is calculated by dividing nominal gold prices by the Consumer Price Index. Recent changes in the Consumer Price Index approximate recent changes in mining and construction costs. 15 Source: Guy Spier. See Zero Management Fees – The Survey Disclaimer The Hirschmann Partnership LP (the “Fund”) began operating on October 1, 2014. The Fund’s principal objective is to achieve positive market returns primarily through fundamental analysis of small- and micro- cap equities in U.S. and foreign markets. Hirschmann Capital LLC (the “General Partner”) seeks to achieve the Fund’s investment objective by identifying equities that are trading at large discounts to actual value. The Fund invests primarily in small- and micro-cap equities in U.S. and foreign markets but also invests in other securities. An investment in the Fund should be considered a long-term investment. The information contained herein reflects the opinions and projections of the General Partner on the publication date. The opinions and projections are subject to change without notice at any time. The General Partner does not represent that any opinion or projection will be realized. All information provided is for information only and is not investment advice or a recommendation to purchase or sell any specific security. The General Partner has an economic interest in the securities discussed in this document, but the General Partner’s economic interest is subject to change without notice. While the information presented herein is believed to be reliable, no representation or warranty is made concerning the accuracy of any data presented. Securities discussed in this document may not remain in the Fund’s portfolio when you receive the document and securities sold may have been repurchased. The securities discussed may not represent the Fund’s entire portfolio. Do not assume any of the securities discussed were or will be profitable. Do not assume that future investment decisions will be profitable or will equal the investment performance of the securities discussed. Past results are no guarantee of future results. No representation is made that an investor is likely to achieve results similar to those shown. All investments involve risk including the loss of principal. Performance results shown are for the Hirschmann Partnership LP and are presented net of all fees, including performance allocation, brokerage commissions and other operating expenses of the Fund. Net performance includes the reinvestment of all dividends, interest, and capital gains. The General Partner does not receive any asset-based management fees. For each Class A Limited Partner, the General Partner is allocated a performance allocation equal to 25% of the amount by which the increase in net asset value exceeds a 6% annualized hurdle rate. For each Class B Limited Partner, the General Partner is allocated a performance allocation equal to 33% of the amount by which the increase in net asset value exceeds the S&P 500 Index. In practice, the performance allocation is earned annually or upon a withdrawal from the Fund. Because some investors may have different fee arrangements and depending on the timing of a specific investment, net performance for an individual investor may vary from the net performance as stated herein. This document refers to indices such as the S&P 500. This does not imply that the Fund will have returns, volatility or other characteristics similar to the indices. The Fund’s holdings may differ significantly from the indices’ underlying securities. The indices have not been selected to be comparative measures of investment performance, but rather are disclosed since they are well-known indices. You may not be able to invest directly in the indices. This document is confidential and may not be distributed without the consent of the General Partner. This document does not constitute an offer or solicitation to purchase or sell any security or investment product. Any such offer or solicitation may only be made by means of an approved Confidential Offering Memorandum. |
Original Post
Editor’s Note: The summary bullets for this article were chosen by Seeking Alpha editors.
#Hirschmann #Capital #YearEnd #Partner #Letter