REIT Performance
REITs kicked off 2025 with a modestly negative January average total return of -1.29%. REITs fell short of the broader market as the Dow Jones Industrial Average (+4.8%), S&P 500 (+2.8%) and NASDAQ (+1.7%) all saw gains to start the year. The market cap weighted Vanguard Real Estate ETF (VNQ) outpaced the average REIT in January (+1.65% vs. -1.29%). The spread between the 2025 FFO multiples of large cap REITs (17.3x) and small cap REITs (12.6x) widened in January, as multiples expanded 0.1 turns for large caps but contracted 0.9 turns for small caps. Investors currently need to pay an average of 37.3% more for each dollar of FFO from large cap REITs relative to small cap REITs. In this monthly publication, I will provide REIT data on numerous metrics to help readers identify which property types and individual securities currently offer the best opportunities to achieve their investment goals.
Source: Graph by Simon Bowler of 2nd Market Capital, Data compiled from S&P Global Market Intelligence LLC. See important notes and disclosures at the end of this article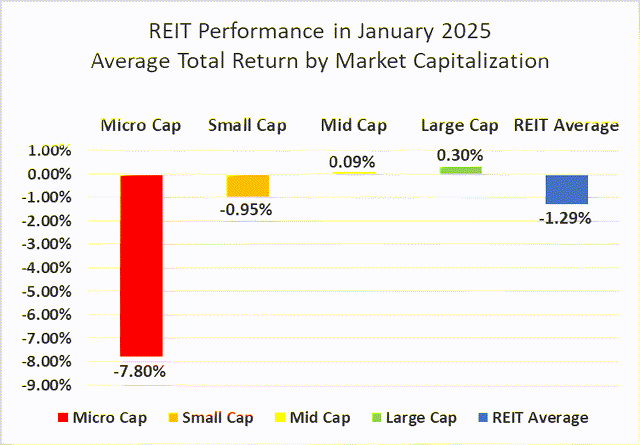
Micro cap REITs (-7.80%), which severely underperformed their larger peers in 2024, continued their losing streak in January. Large caps (+0.30%) and mid caps (+0.09%) eked out narrow gains, but small caps (-0.95%) averaged a modest negative return. After the first month of 2025, large cap REITs have outperformed small caps by 126 basis points.
7 out of 18 Property Types Yielded Positive Total Returns in January
38.9% of REIT property types averaged a positive total return in January. There was a 15.14% total return spread between the best and worst performing property types. Timber (+7.63%) and Industrial (+4.06%) had the strongest start to 2025. Single Family Housing (-7.51%) and Shopping Center REITs (-6.46%) started the year deep in the red.
Source: Table by Simon Bowler of 2nd Market Capital, Data compiled from S&P Global Market Intelligence LLC. See important notes and disclosures at the end of this article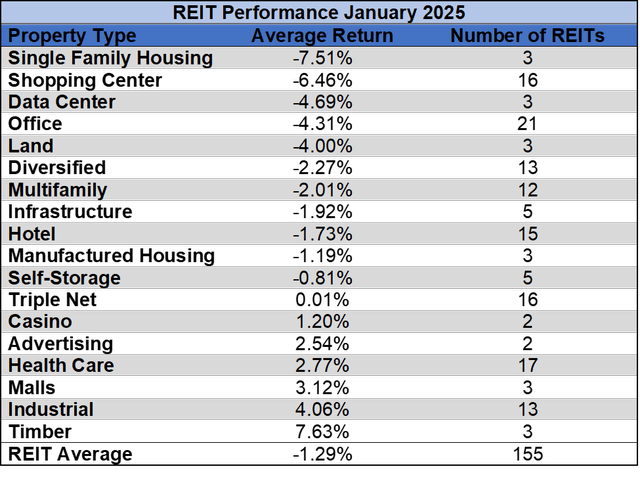
The REIT sector as a whole saw the average P/FFO (2025Y) decrease 0.2 turns in January from 13.8x down to 13.6x. 50% of property types averaged multiple contraction, 44.4% averaged multiple expansion and 5.6% saw multiples hold steady in January. Land (32.1x), Data Centers (28.6x), Manufactured Housing (18.8x), Single Family Housing (18.3x) and Multifamily (17.1x) currently trade at the highest average multiples among REIT property types. Hotels (7.2x) and Office (9.1x) are the only property types that average single digit FFO multiples.
Source: Table by Simon Bowler of 2nd Market Capital, Data compiled from S&P Global Market Intelligence LLC. See important notes and disclosures at the end of this article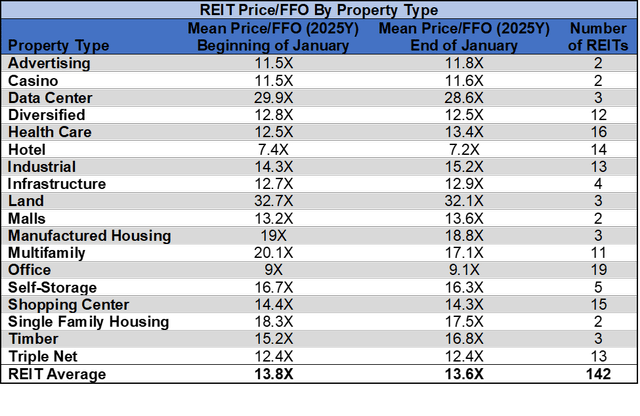
Performance of Individual Securities
Medical Properties Trust (MPW) (+18.73%) outperformed all other equity REITs in a very event-filled month for the health care REIT. MPW’s long struggling tenant Prospect Medical Holdings finally filed for bankruptcy on January 11th and on January 31st MPW refinanced large loans that would have matured in 2025 and 2026 with new notes maturing in 2032.
Creative Media & Community Trust (CMCT) (-66.22%) plummeted in January. CMCT announced a 1-for-10 reverse stock split on the first trading day of the year, but the share price continued to rapidly collapse down toward the pre-split price.
42.58% of REITs had a positive total return in January. REITs averaged a -1.29% total return in January 2025, which was actually a less painful start to the year than REITs had the prior January (-5.72%).
For the convenience of reading this table in a larger font, the table below is available as a PDF as well.
Source: Table by Simon Bowler of 2nd Market Capital, Data compiled from S&P Global Market Intelligence LLC. See important notes and disclosures at the end of this article Source: Table by Simon Bowler of 2nd Market Capital, Data compiled from S&P Global Market Intelligence LLC. See important notes and disclosures at the end of this article Source: Table by Simon Bowler of 2nd Market Capital, Data compiled from S&P Global Market Intelligence LLC. See important notes and disclosures at the end of this article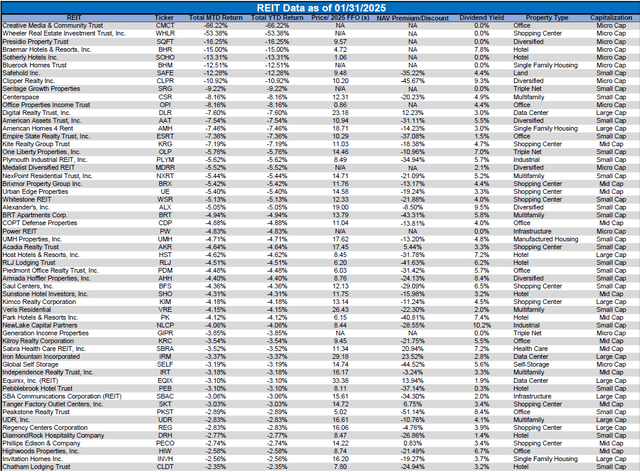
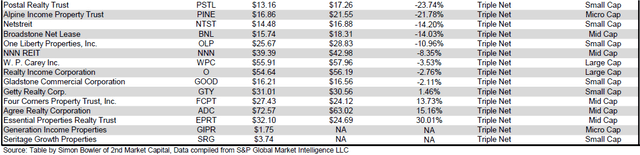
Dividend Yield
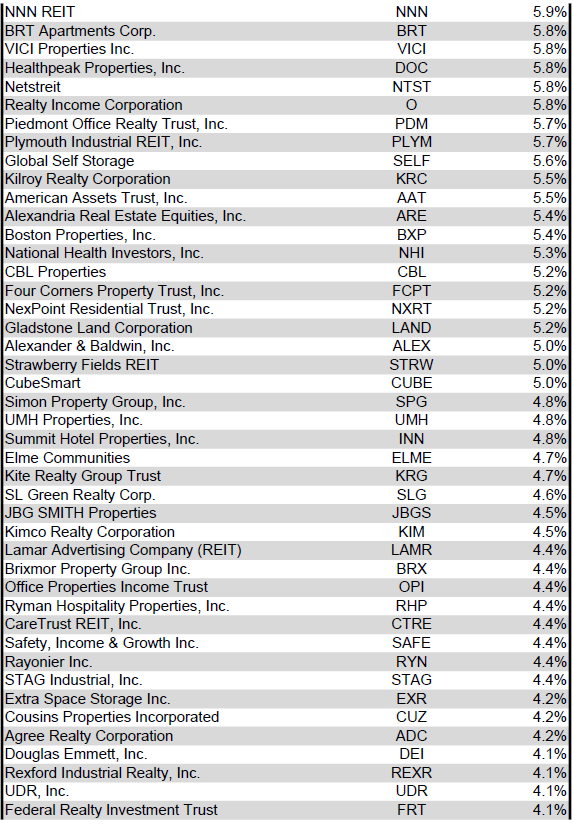
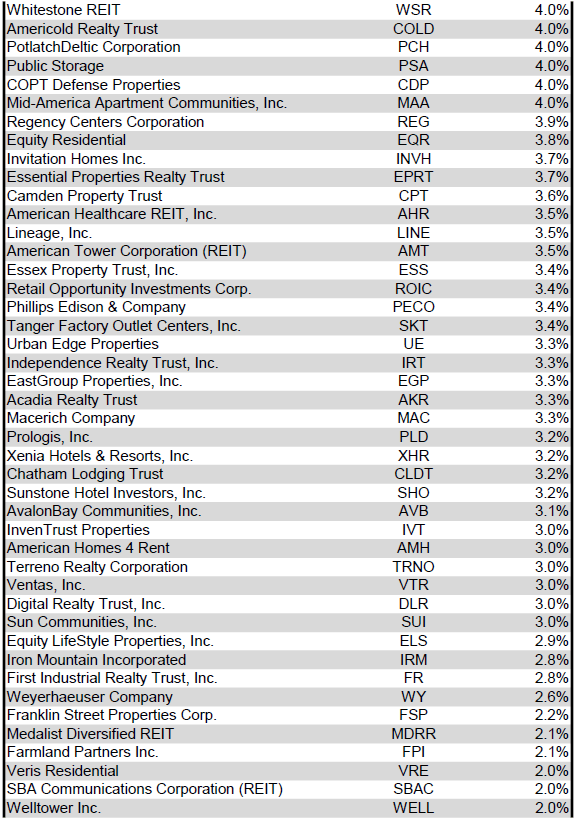
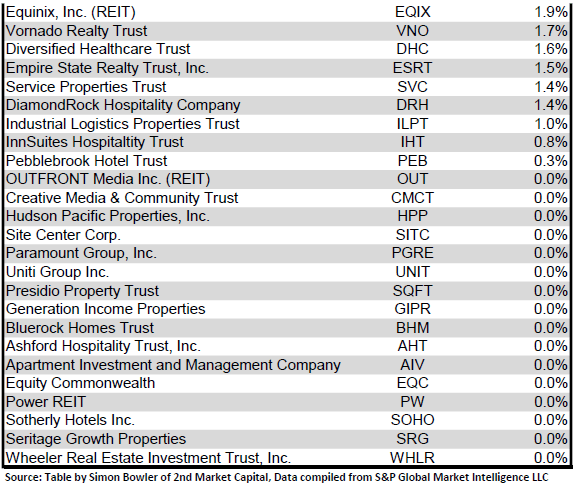
Dividend yield is an important component of a REIT’s total return. The particularly high dividend yields of the REIT sector are, for many investors, the primary reason for investment in this sector. As many REITs are currently trading at share prices well below their NAV, yields are currently quite high for many REITs within the sector. Although a particularly high yield for a REIT may sometimes reflect a disproportionately high risk, there exist opportunities in some cases to capitalize on dividend yields that are sufficiently attractive to justify the underlying risks of the investment. I have included below a table ranking equity REITs from the highest dividend yield (as of 1/31/2025) to the lowest dividend yield.
For the convenience of reading this table in a larger font, the table below is available as a PDF as well.
Source: Table by Simon Bowler of 2nd Market Capital, Data compiled from S&P Global Market Intelligence LLC. See important notes and disclosures at the end of this article Source: Table by Simon Bowler of 2nd Market Capital, Data compiled from S&P Global Market Intelligence LLC. See important notes and disclosures at the end of this article Source: Table by Simon Bowler of 2nd Market Capital, Data compiled from S&P Global Market Intelligence LLC. See important notes and disclosures at the end of this article Source: Table by Simon Bowler of 2nd Market Capital, Data compiled from S&P Global Market Intelligence LLC. See important notes and disclosures at the end of this article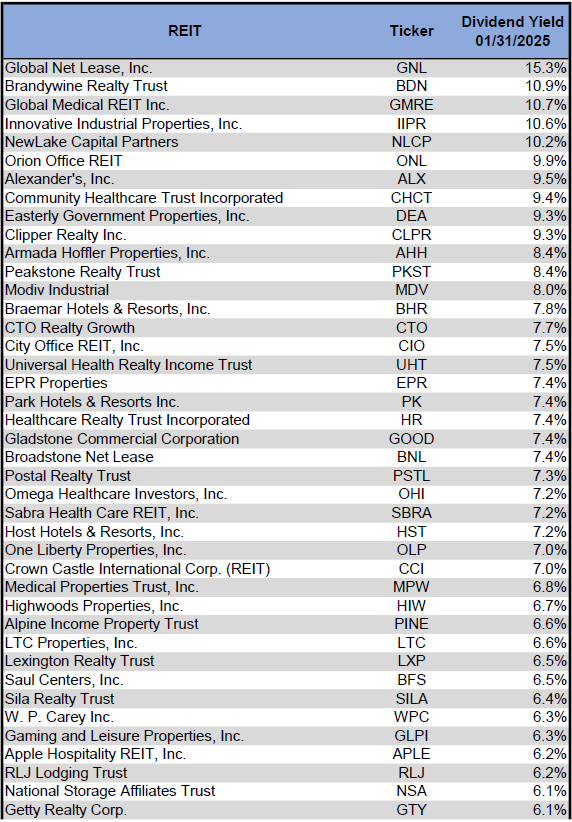
Although a REIT’s decision regarding whether to pay a quarterly dividend or a monthly dividend does not reflect on the quality of the company’s fundamentals or operations, a monthly dividend allows for a smoother cash flow to the investor. Below is a list of equity REITs that pay monthly dividends ranked from the highest yield to the lowest yield.
Source: Table by Simon Bowler of 2nd Market Capital, Data compiled from S&P Global Market Intelligence LLC. See important notes and disclosures at the end of this article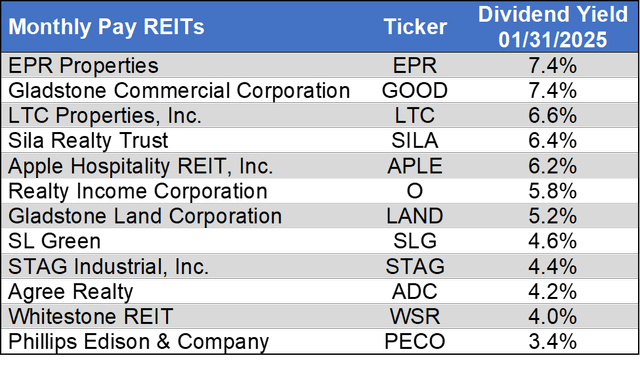
Dividend News
3 REITs announced dividend hikes in January, 2 of which pay quarterly dividends and 1 of which pays monthly. Medalist Diversified REIT (MDRR) (+8.3%) announced the largest dividend increase followed by Postal Realty Trust (PSTL) (+1.0%) and STAG Industrial (STAG) (+0.7%).
Source: S&P Global Market Intelligence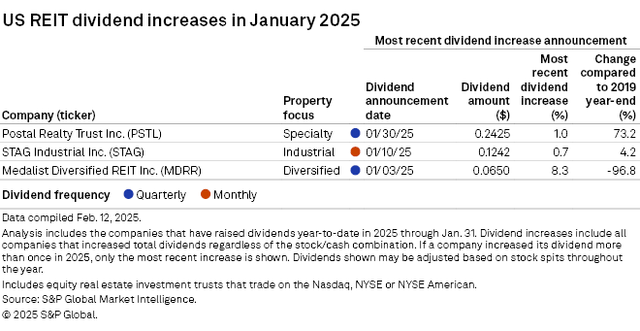
A majority (53.9%) of REITs currently pay a higher dividend than they did pre-COVID (the end of 2019). 6.3% have the same dividend they did pre-COVID and 39.8% have a reduced or suspended dividend.
Source: S&P Global Market Intelligence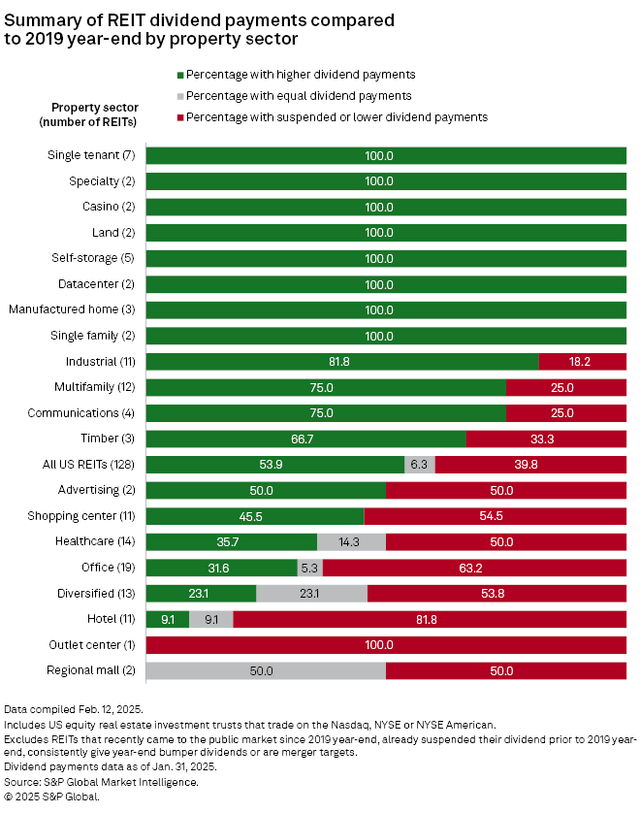
A number of REIT property types saw across the board dividend increases since the end of 2019. 100% of REITs have increased their dividend within the Single-tenant Triple Net, Casino, Land, Self-storage, Data Center, Manufactured Housing and Single Family Housing property types. However, none of the Mall or Outlet Center REITs have a higher dividend today than they did at the end of 2019.
Valuation
REIT Premium/Discount to NAV by Property Type
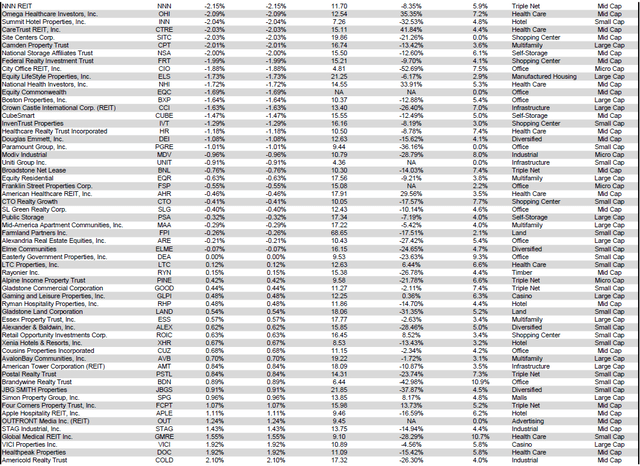
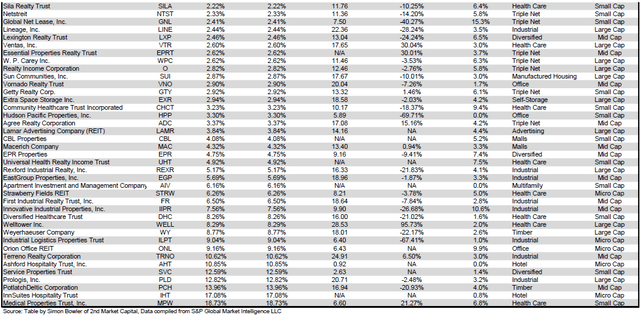
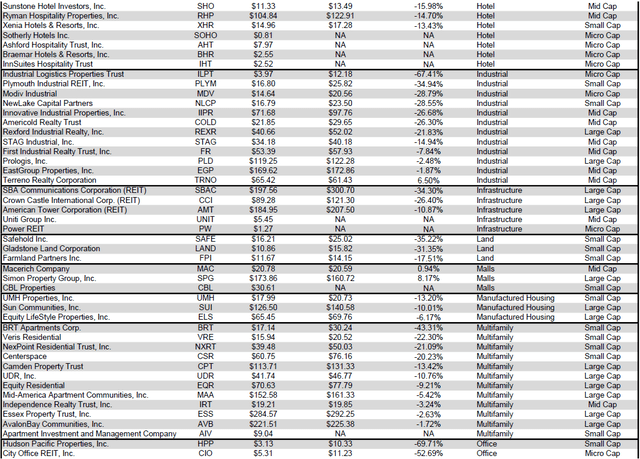
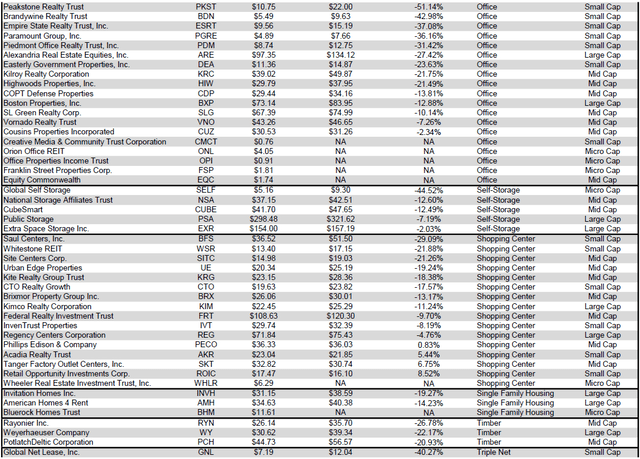
Below is a downloadable data table, which ranks REITs within each property type from the largest discount to the largest premium to NAV. The consensus NAV used for this table is the average of analyst NAV estimates for each REIT. Both the NAV and the share price will change over time, so I will continue to include this table in upcoming issues of The State of REITs with updated consensus NAV estimates for each REIT for which such an estimate is available.
For the convenience of reading this table in a larger font, the table below is available as a PDF as well.
Source: Table by Simon Bowler of 2nd Market Capital, Data compiled from S&P Global Market Intelligence LLC. See important notes and disclosures at the end of this article Source: Table by Simon Bowler of 2nd Market Capital, Data compiled from S&P Global Market Intelligence LLC. See important notes and disclosures at the end of this article Source: Table by Simon Bowler of 2nd Market Capital, Data compiled from S&P Global Market Intelligence LLC. See important notes and disclosures at the end of this article Source: Table by Simon Bowler of 2nd Market Capital, Data compiled from S&P Global Market Intelligence LLC. See important notes and disclosures at the end of this article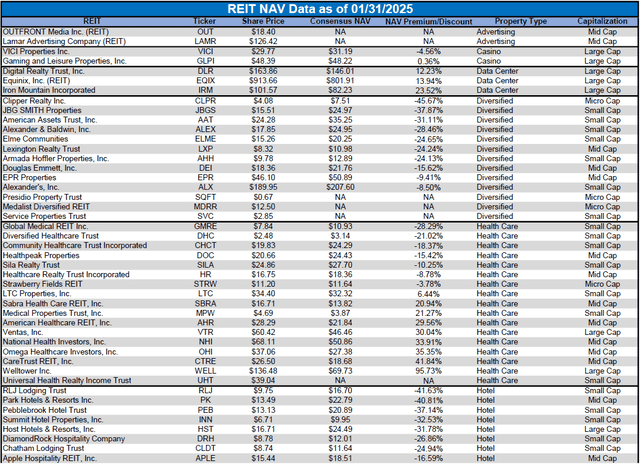
Takeaway
The large cap REIT premium (relative to small cap REITs) widened in January and investors are now paying on average about 37% more for each dollar of 2025 FFO/share to buy large cap REITs than small cap REITs (17.3x/12.6x – 1 = 37.3%). As can be seen in the table below, there is presently a strong positive correlation between market cap and FFO multiple.
Source: Table by Simon Bowler of 2nd Market Capital, Data compiled from S&P Global Market Intelligence LLC. See important notes and disclosures at the end of this article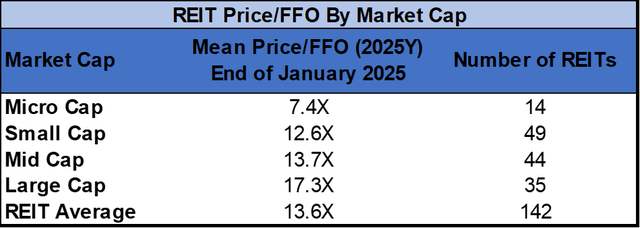
The table below shows the average NAV premium/discount of REITs of each market cap bucket. This data, much like the data for price/FFO, shows a strong, positive correlation between market cap and Price/NAV. The average large cap REIT (-4.80%) and mid cap REIT (-5.92%) trade at mid single-digit discounts to NAV. Small cap REITs (-23.27%) trade at a little over 3/4 of NAV and micro caps (-37.81%) trade at less than 2/3 of their respective NAVs.
Source: Table by Simon Bowler of 2nd Market Capital, Data compiled from S&P Global Market Intelligence LLC. See important notes and disclosures at the end of this article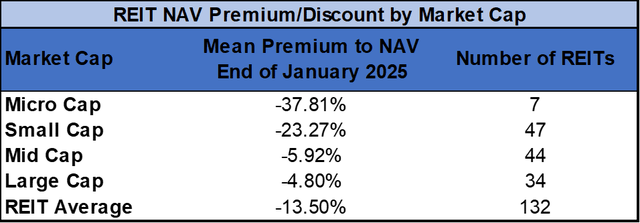
Economic Health
2024 had the highest number of corporate bankruptcies in 14 years and January 2025 continued that painful upward trend. January 2025 had twice the number of bankruptcies as January 2024 (70 vs. 35) as high interest rates continue to take a toll on heavily indebted companies.
Source: S&P Global Market Intelligence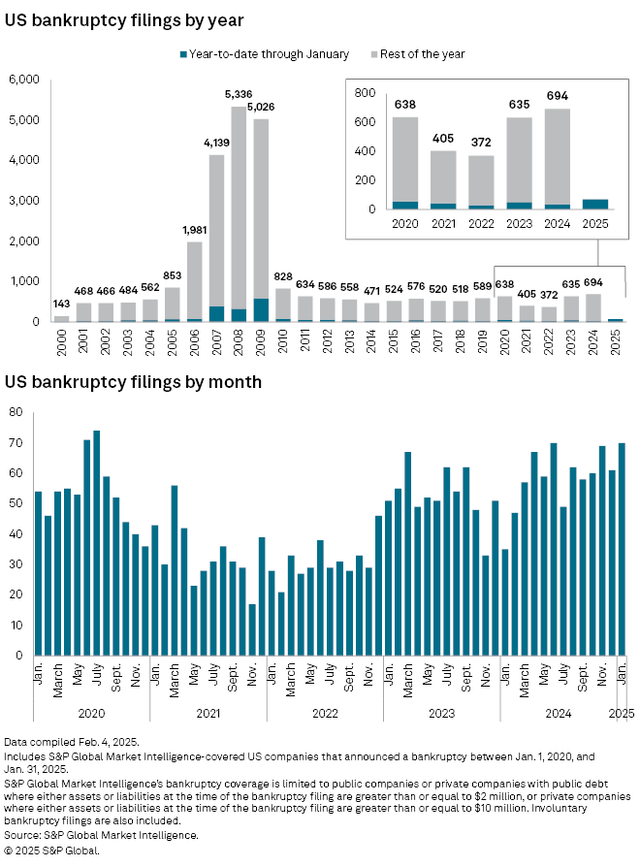
REITs Overall Saw a Slight Decrease in Short Interest in January, But Short Interest Remains Very High for Some REITs
Source: S&P Global Market Intelligence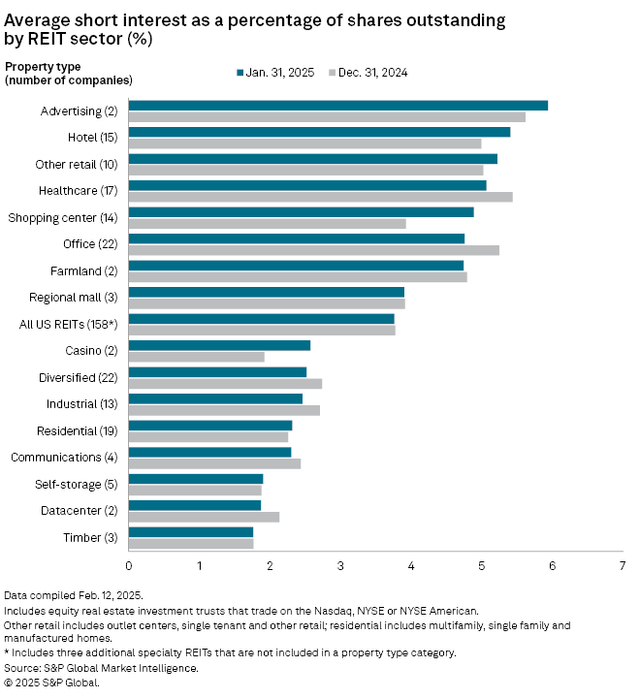
Average REIT short interest remained largely flat in January as it declined by just 1 basis point to 3.8% of shares outstanding. Advertising REITs continue to average the highest short interest (5.9%) followed by Hotels (5.4%). Timber (1.8%) and Data Centers (1.9%) had the lowest average short interest at the end of January. Shopping Center REITs saw the highest increase in average short interest (+96 bps) in January, whereas Office REITs averaged the largest decrease (-65 bps).
Source: S&P Global Market Intelligence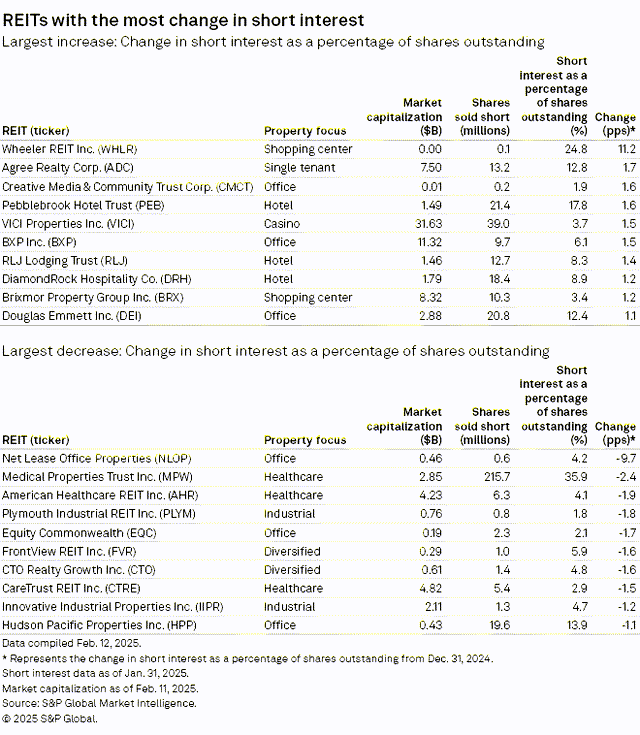
Wheeler REIT (WHLR) saw the biggest increase (+11.2%) in short interest in January as the share price continues a multi-year freefall. Agree Realty (ADC) (+1.7%) and Creative Media & Community Trust (CMCT) (+1.6%) rounded out the top 3 short interest increases. The 10 REITs that saw the biggest declines in short interest were concentrated in 4 property types: Office, Healthcare, Industrial and Diversified. Net Lease Office Properties (NLOP) saw the biggest decline in short interest (-9.7%) followed by Medical Properties Trust (MPW) (-2.4%) and American Healthcare REIT (AHR) (-1.9%).
Source: S&P Global Market Intelligence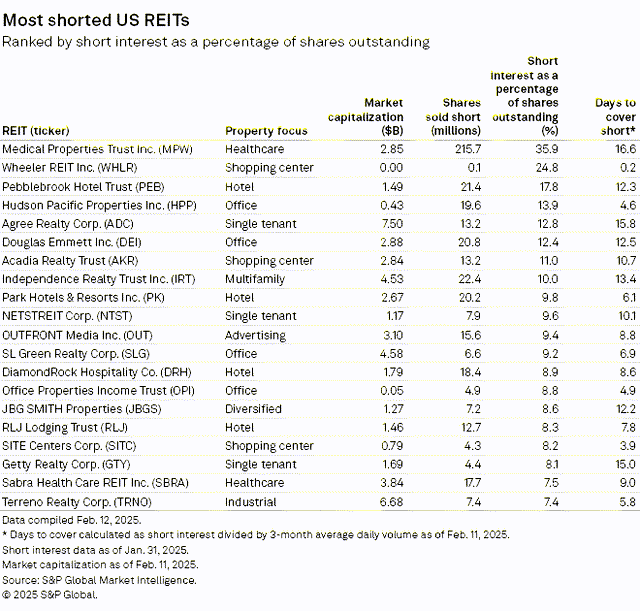
Closing a short position requires buying back shares in the position that was shorted. This means that companies with very high short interest can potentially experience strong upward pressure on share price when the short thesis materially weakens. A 2.4% reduction in the short interest of MPW helped propel the healthcare REIT to the highest total return in the REIT sector in January. With 35.9% of shares of MPW still held short and a whopping 16.6 days to cover, this heavy short interest could prove to be a strong tailwind if the short thesis fails to play out. Other REITs with high days to cover are Agree Realty Trust (ADC) (15.8 days), Getty Realty (GTY) (15.0 days) and Independence Realty Trust (IRT) (13.4 days). Heavy short interest can often be warranted by material risks and/or declining fundamentals, so it is important to fully understand these issues prior to initiating either a long or short position in any REIT. However, there is a potential for outsized gains when an investor correctly identifies which highly shorted REITs will not see the short thesis come to fruition.
Editor’s Note: This article covers one or more microcap stocks. Please be aware of the risks associated with these stocks.
#State #REITs #February #Edition