Hello readers,
Thanks for joining us. Forgive me if I swap from plural to singular. Sometimes my dogs are here while I’m writing and sometimes my wife is luring them away with food.
You know how sometimes I run through a bunch of stocks without going deep on any of them? Let’s do that again. Why? Because that’s the article I feel like writing. I spend most of my time working on research for The REIT Forum, but I want to make sure all my readers get something to enjoy.
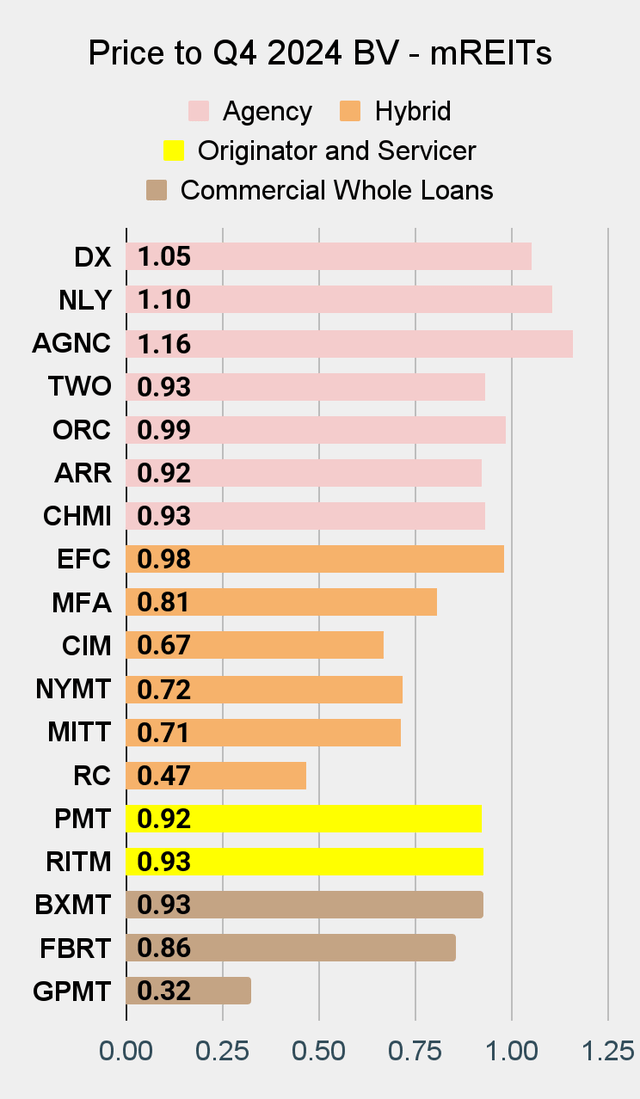
We’re starting with common shares. Annaly Capital Management (NLY) is down about 3% since our prior sector article. That’s an improvement. Price-to-book ratios have been really high for the agency mortgage REITs.
Last time we wrote on the sector, we said:
I think investors in agency mortgage REITs should be looking to capture gains.
I didn’t add the bolding retroactively. It was bolded and treated as a separate paragraph in the prior article.
Since then, the valuations dipped for every agency mortgage REIT. Does that make them cheap today? No. But it does reduce the downside risk.
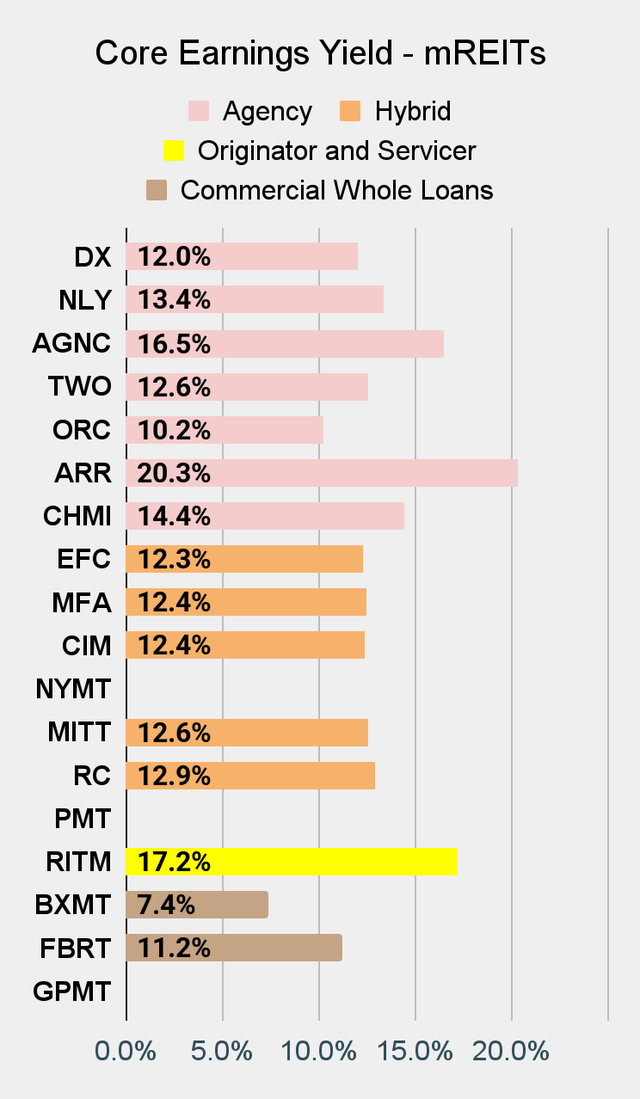
Highest price-to-book? Still AGNC Investment (AGNC). Their earnings yield figure still looks pretty high as the portfolio is structured to report high core earnings. Please don’t tell me that reporting “high core earnings” is the same thing as great portfolio management. Invesco Mortgage Capital (IVR) has an absolutely massive earnings yield. What did they do recently? They cut their dividend from $.40 per share (quarterly) to $.34 per share. Isn’t that interesting? The “core earnings” figure looked good. There’s more to portfolio management than making the earnings figure look good.
What else is going on?
Ellington Financial (EFC) has a much higher price-to-book than other hybrid mortgage REITs. It would be tempting to assume that the higher ratio reflected a disproportionately large amount of agency assets. That isn’t the case. The agency MBS strategy only accounts for 2% of their equity. Meanwhile, they had 86% allocated to “credit.” See the chart from EFC below:
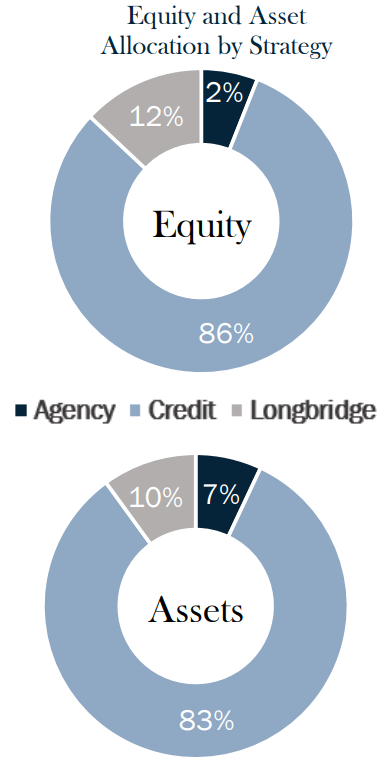
EFC
Perhaps a better explanation is that EFC tends to be more volatile in their reported economic returns:
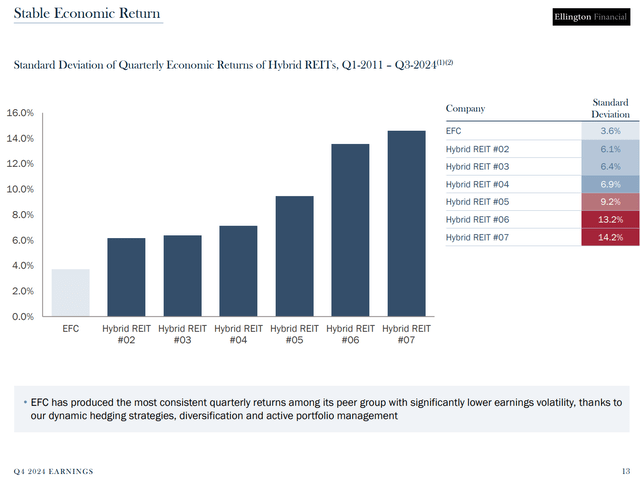
Chart
I’m thinking that could be a material factor. Investors prefer less volatility. At least smart investors do. I’m not loving the valuation of EFC or hating on it. Not sharing our rating right now. Just sharing a hypothesis for why EFC gets a higher price-to-book ratio.
If you exclude EFC, the price-to-book ratios for hybrid mortgage REITs run in the .49 to .80 range.
Commercial Mortgage REITs
The difference in price-to-book ratios is massive. What’s to blame? You might say that Blackstone (BXMT) is excellent at managing shareholders’ money. That they did a much better job navigating the crisis in commercial lending. Or you could say that GPMT’s management did a dreadful job at basically everything. They originated dumb loans. They focused on the wrong metrics. They did a poor job managing their overhead. They even directed the new Snow White movie. Well, maybe one of those is false. But I’m leaving you to guess which one.
Equity REITs
Is this an article for equity REITs? No. Do I care? No. If you’ve read my work before, you should know that.
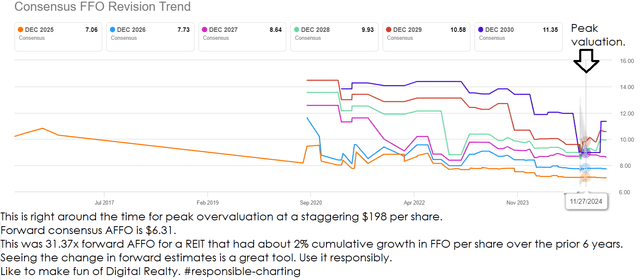
I want to talk about Digital Realty Trust (DLR). A laughably overhyped data center REIT. Is DLR great? Sure, if your definition of “greatness” is “capable of issuing large amounts of common equity for years while delivering dreadful growth in FFO and AFFO per share despite massive yields on new construction.”
One could be forgiven for thinking that the big yields on those projects were helping to subsidize challenging performance on other properties. They could be forgiven for thinking it very easily because that’s what the evidence suggests.
Here’s the history:
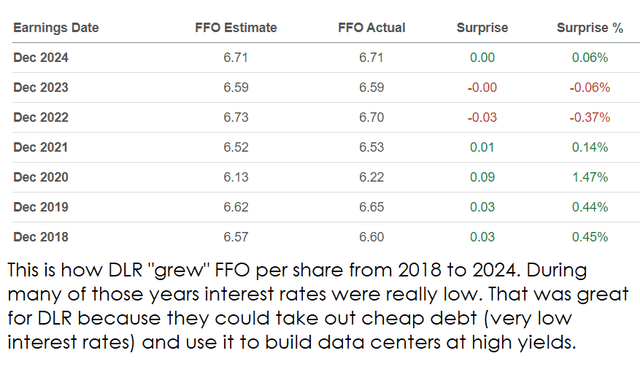
Seeking Alpha Premium
DLR benefits from having unrealistically high estimates for future AFFO per share, as demonstrated in this chart:
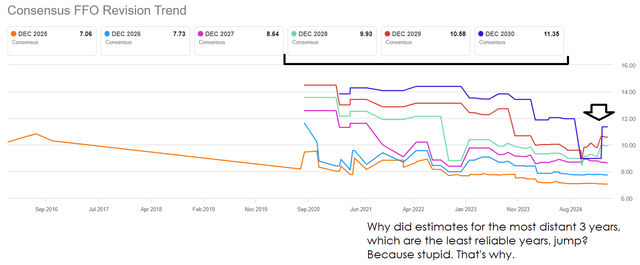
Seeking Alpha Premium
This is available under the DLR tab using earnings and then revisions.
I like being able to see the future estimates and the change in the future estimates. It can be a useful tool in understanding what’s happening with a company. However, always take it with more than a grain of salt. I’ve seen some analysts look at the decline in consensus estimates for future years. Nothing wrong with that! Except for the problem. The analysts proclaim that the reason the shares are up or down is a change in the estimates. Sounds great, but you need to use more brainpower. At least check how other companies are doing and compare their price history with the forward estimates to see if there’s any correlation at all.
Seeking Alpha Premium
Preferred Shares
I’m pretty much done writing, but I’ve still got this header. OK, here we go.
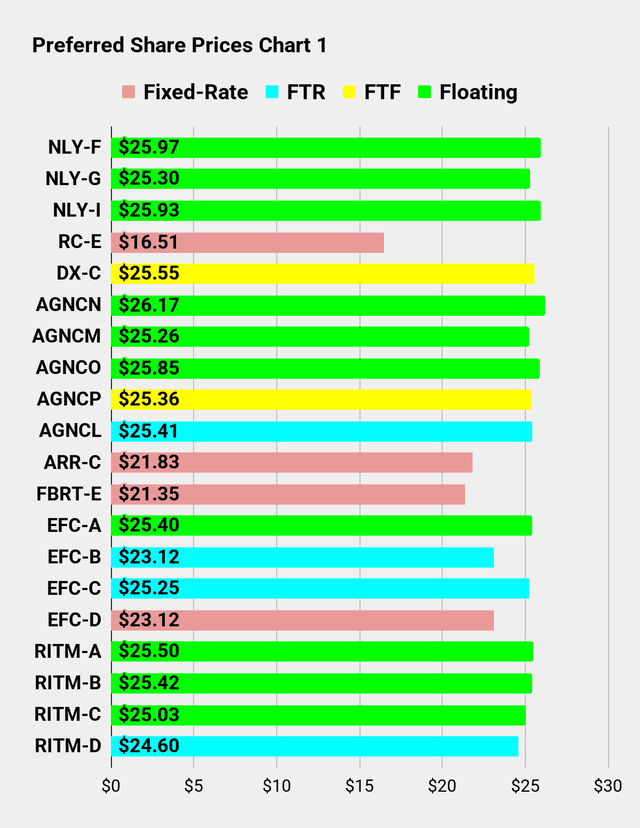
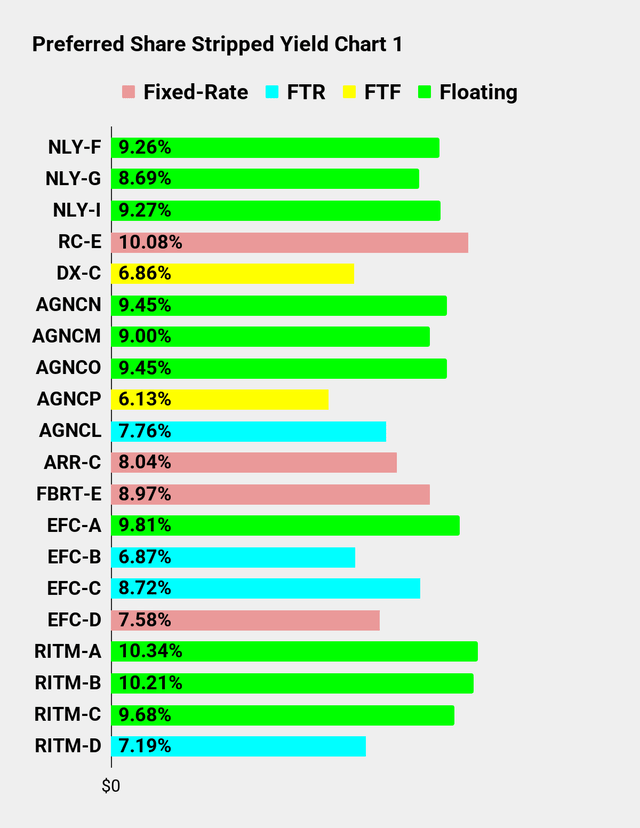
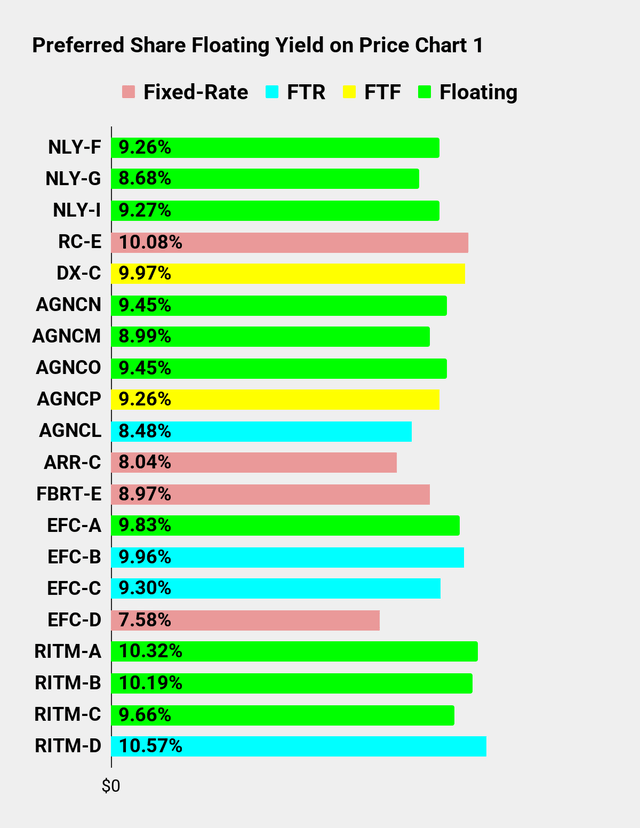
Most of the preferred shares from AGNC and NLY are overvalued. The ones with good spreads trade at severely negative yields to call. The ones with poor spreads over floating rates can still trade at a premium. Well, mostly, I just mean NLY-G. That share has a thin floating spread but trades at a negative yield to call. If you’re objective is to own floating-rate mortgage REIT shares with thin spreads and lower risk ratings, consider AGNCM as an alternative to NLY-G. The floating spread is still bad (4.332% vs. 4.172%). However, AGNCM trades at $25.26 compared to NLY-G at $25.30. Now, you would be right to say that $.04 is basically nothing. But NLY-G went ex-dividend at the start of March. AGNCM goes ex-dividend several days from now.
That means AGNCM has about 2 extra months of dividend accrual compared to NLY-G. That’s $.53 in accrual for AGNCM compared to $.14 for NLY-G. Now, which one sounds better? The difference of $.04 isn’t much, but the difference of $.39 in accrual does matter. Combined, that’s a difference of $.43. We rate the Annaly preferred shares as a bit lower risk due to better coverage ratios, but it’s not a huge difference. If AGNCM were called immediately (extremely unlikely), the investor would earn an outstanding yield to call.
OK, that finishes the article. Charts below.
All The Stocks
The charts compare the following companies and their preferred shares or baby bonds:
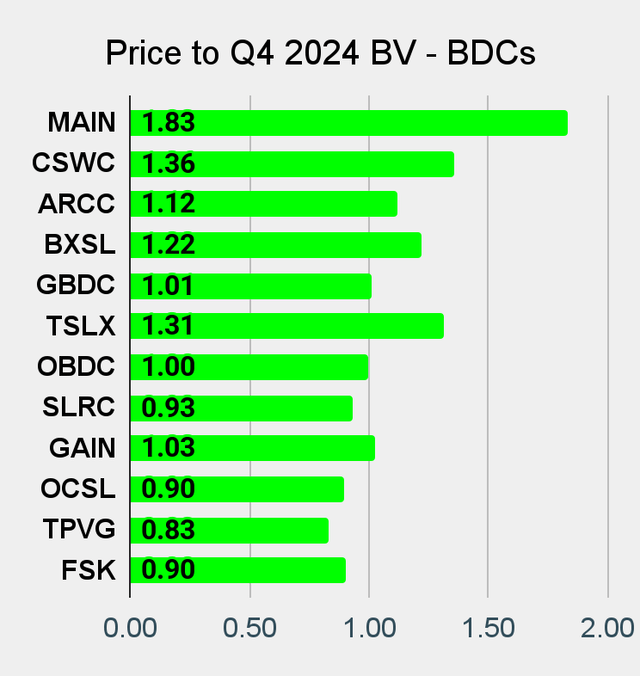
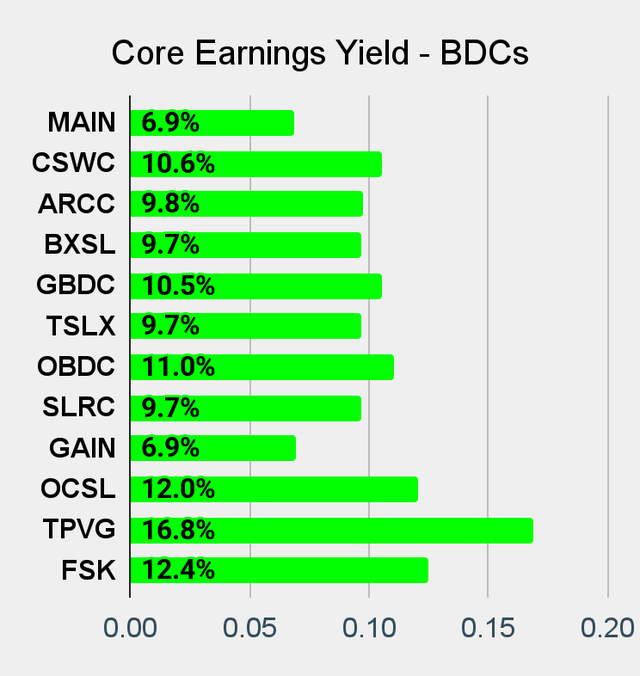
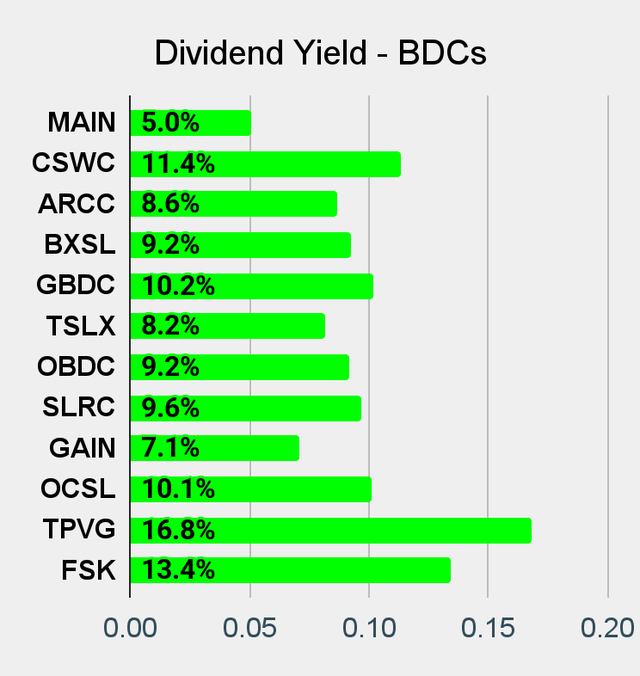
- BDCs: (CSWC), (BXSL), (TSLX), (OCSL), (GAIN), (TPVG), (FSK), (MAIN), (ARCC), (GBDC), (OBDC), (SLRC)
- Commercial mREITs: (GPMT), (FBRT), (BXMT)
- Residential Hybrid mREITs: (MITT), (CIM), (RC), (MFA), (EFC), (NYMT)
- Residential Agency mREITs: (NLY), (AGNC), (CHMI), (DX), (TWO), (ARR), (ORC)
- Residential Originator and Servicer mREITs: (RITM), (PMT)
Embedded Charts
Mortgage REITs and BDCs:
 The REIT Forum |
 The REIT Forum |
 The REIT Forum |
 The REIT Forum |
 The REIT Forum |
 The REIT Forum |
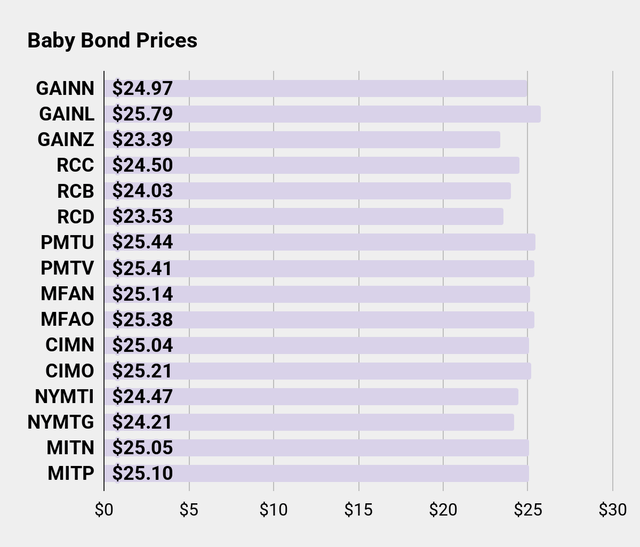
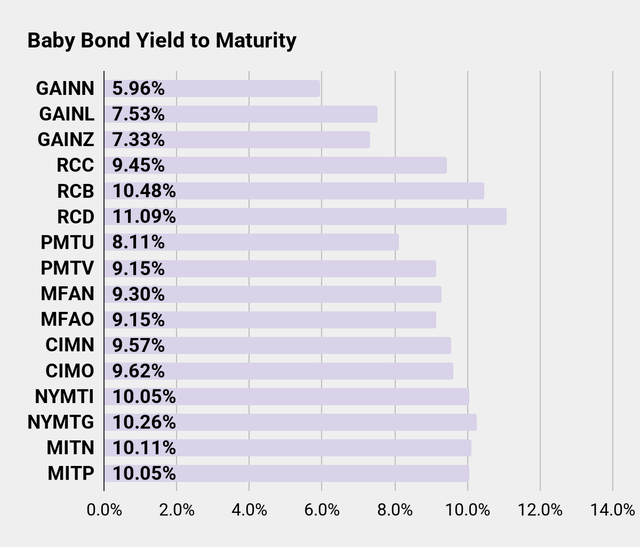
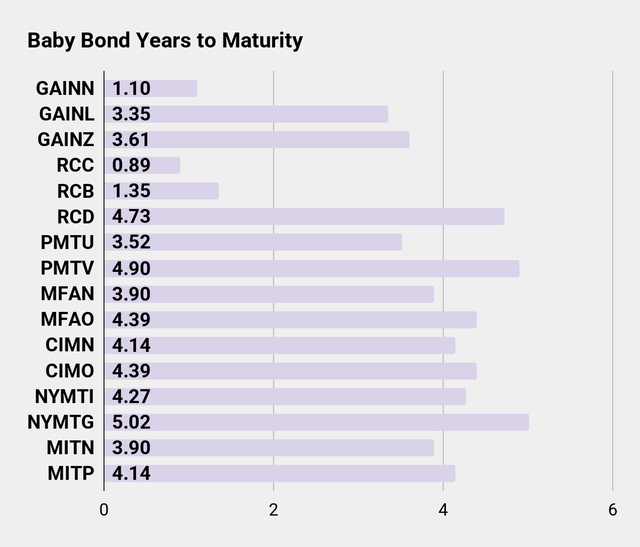
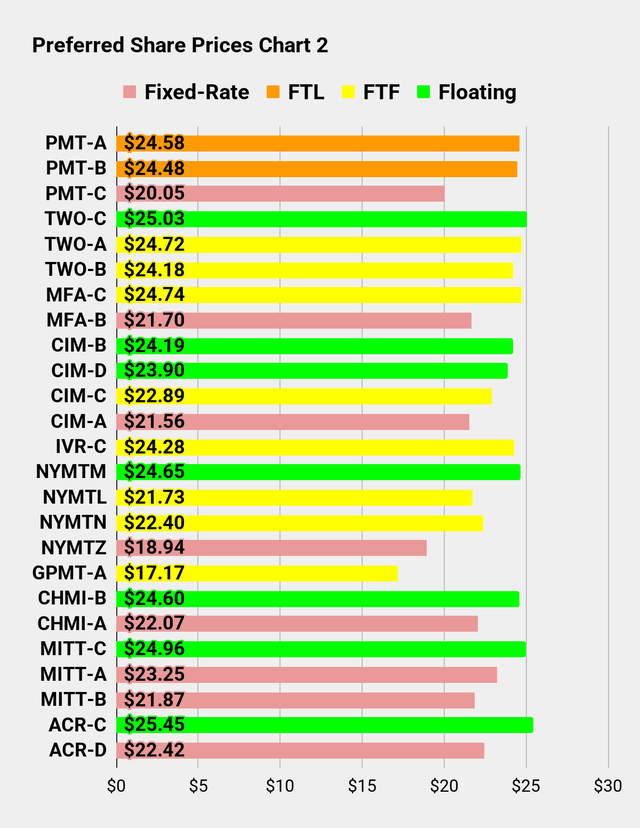
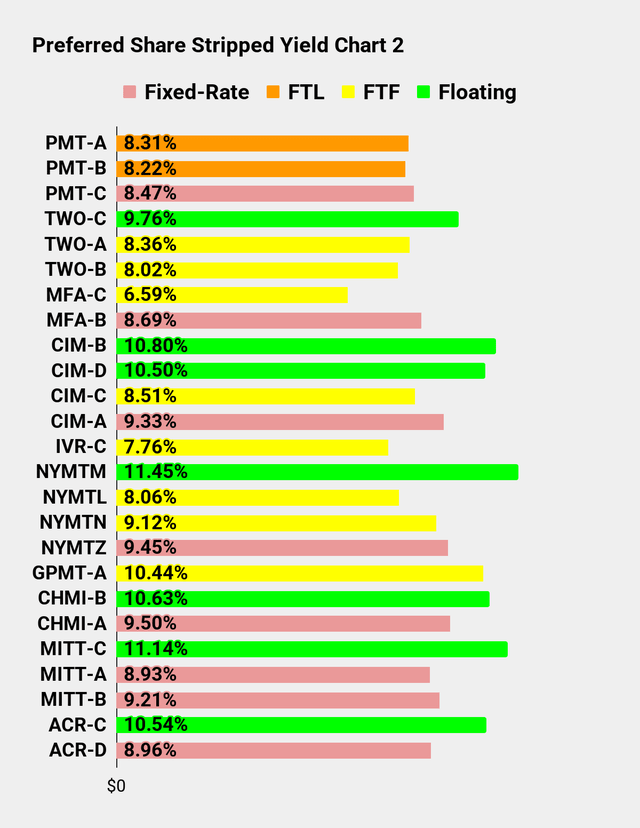
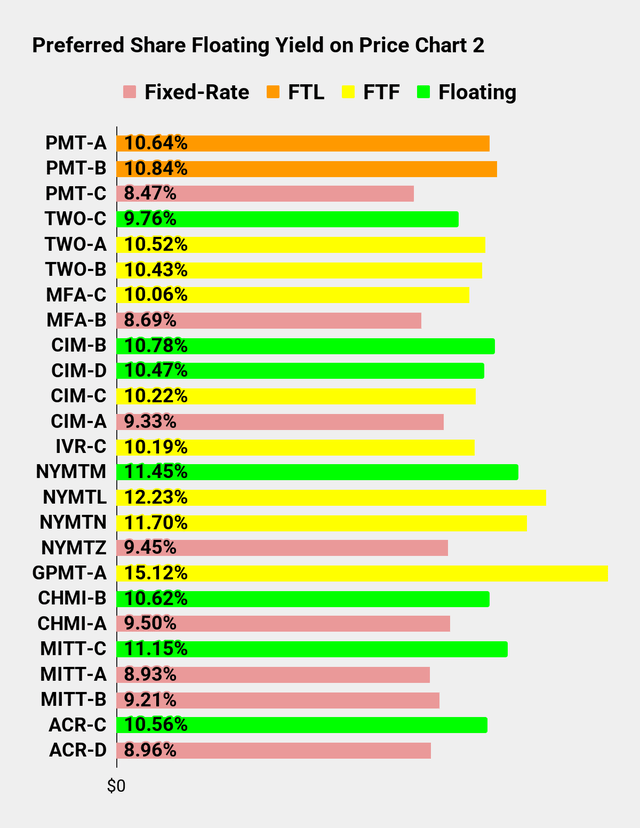
Preferred shares and baby bonds:
 The REIT Forum |
 The REIT Forum |
 The REIT Forum |
 The REIT Forum |
 The REIT Forum |
 The REIT Forum |
 The REIT Forum |
 The REIT Forum |
 The REIT Forum |
Thanks for reading, and I hope you enjoyed the charts.
Some terminology:
- FTF = Fixed-to-floating. Share is currently fixed, but will begin floating based on SOFR. We may reference LIBOR, but that’s assumed to be SOFR + 0.26161%.
- FTR = Fixed-to-reset. Share is currently fixed. It will eventually begin resetting every 5 years based on the 5-year Treasury rate.
- FTL = Fixed-to-lawsuit. The company decided that their FTF shares could be “fixed-to-fixed” despite clearly violating the original intent of the contract.
- Floating = A share that was FTF, but is now floating. The dividend rate is updated every 3 months.
Thank You
Build a foundation for steady income with REITs
As demand for key real estate sectors increases and supply fails to keep pace, 2025 presents a prime opportunity to invest in REITs, Preferreds, and BDCs.
The REIT Forum offers a proven, transparent approach with actionable insights. Led by Colorado Wealth Management Fund (aka Michael VanLoon) and an expert team, subscribers receive precise trade alerts, portfolio tracking, and exclusive articles. Strategies from The REIT Forum have consistently outperformed sector indexes for nearly a decade.
Start your risk-free two-week trial today and capitalize on the power of real estate returns.
#Lets #Talk #Mortgage #REITs #Long