I going to make a greatest artwork as I can, by my head, my hand and by my mind.
“Ladies and gentlemen, this is your stewardess speaking… We regret any inconvenience the sudden cabin movement might have caused, this is due to periodic air pockets we encountered, there’s no reason to become alarmed, and we hope you enjoy the rest of your flight… By the way, is there anyone on board who knows how to fly a plane?”
-Airplane!
Dear Client,
For the first quarter of 2025, every primary asset class provided positive returns except equities which were down -0.9%. The modest decline in global equities masked a greater weakening in the US and presaged additional turbulence. US equities (the S&P 500) were down -4.3%.
Magnificent Seven (Mag7) stocks, home to the greatest speculation, and US small capitalization stocks, the most economically sensitive, were hit the hardest. Mag7 shares were down -15.70% and small caps were down -9.5%. 1
Gold was the hero, up 19.0% during the period. Commodities also performed well, up 4.6%. With equities down, the “safe-haven” long-dated US Treasury bond increased 5.0%. (Though after the quarter’s close, with the introduction of extensive tariffs on April 2, there are signs this relationship between long-dated US Treasury bonds and stocks may be breaking down, at least in the short-term. The other safe-haven asset, gold, continues to outperform post April 2.)
During this period, the Grey Owl All-Season strategy returned 1.5% versus the 60/40 benchmark’s return of 0.5% 2. Downside volatility increased significantly in the three weeks since the quarter’s end and spread beyond US equities. Year-to-date through Thursday, April 17 (markets are closed on Good Friday), the Grey Owl All-Season strategy returned approximately -0.4%. This compares favorably to the benchmark which is now down -2.3% as US equities dropped further, and foreign equities joined the selloff. The previously sainted Mag7 continues to lead the way lower now down -21.9% for the year.
Context
The recent volatility has been significant, as has the correction in the most prominent stocks such as Nvidia (NVDA) and the other Mag7. Given the focus these companies have received in both financial and popular press during the past few years, the impact can feel tremendous.
However, it is worth looking at where markets were when this correction began.
Valuation is a tricky business. Somewhat unknowable and all but useless in the short term (which can be years or even decades). That said, it’s important to see that the current correction began from never-before-seen heights using common metrics and prices remain extremely elevated by historical standards.
Figure 1 – https://www.advisorperspectives.com/dshort/updates/2025/04/02/market-valuation-is-the-market-still-overvalued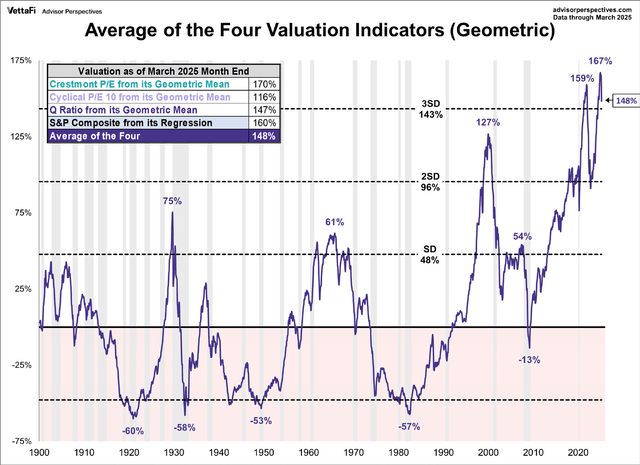
We are emphatically not forecasting a full reversion to the mean on any of these valuation metrics. Though, we are not ruling that out either. Rather, we show the chart for two reasons. First, given valuation levels, investors should not be surprised at all by the recent correction. The drop may have been “triggered” by tariffs, but the existing “critical state” is what made equities vulnerable. Second, while trend following and other programmatic buying may return, we are a long way from where a “value investor” would start buying US equities. That means air pocket drops lower can continue. Further, if tariffs, DOGE, or anything else leads to widespread job losses, the “passive bid” from retirement plans would wane, putting further downward pressure on asset prices.
Economic Growth
Most “risk-off” environments slightly precede, then run concurrently with periods of growth slowing and dis-inflation. We are experiencing both and as the “rules of the game” remain in flux (e.g. tariffs) the economic uncertainty increases the odds of further weakness. Note that full blown recessions are not required for risk assets to drop, just slowing growth and dis- inflation.
To highlight this point, we return to ISM Manufacturing PMI we show most quarters. The manufacturing economy has remained in contractionary mode now for most of the last 24 months. Recall that the (PMI) summarizes in a single data point the state of the US economy. The PMI is a “diffusion index” which aggregates survey data from decision makers throughout the manufacturing economy. The questions are around the managers’ expectations (e.g. “do you plan to acquire more or less inventory next month compared to this month) and are thus a leading indicator of economic activity.
Figure 2 – US ISM Manufacturing PMI monthly https://ycharts.com/indicators/us_pmi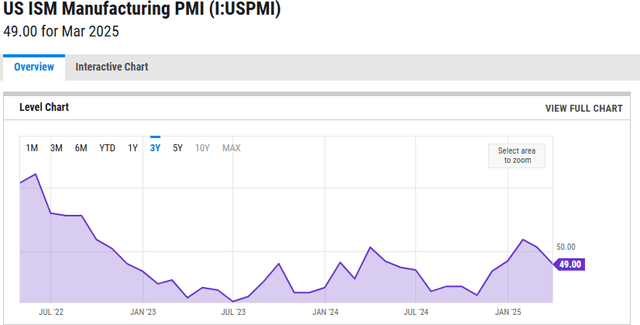
Inflation
The 5-Year Breakeven 3 rate has been dropping since February. The threat of returning runaway inflation continues to decrease by this measure.
Figure 3 -5-Year Breakeven www.tradingview.com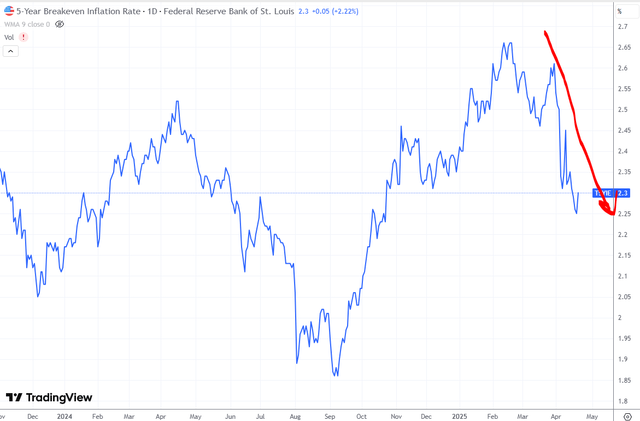
Hedgeye’s Consumer Price Index (CPI) projections corroborate the current dis-inflation shown in the 5-Year Breakeven, BUT they forecast a reacceleration in the back half of the year.
Figure 4 – Inflation Projections ( www.hedgeye.com)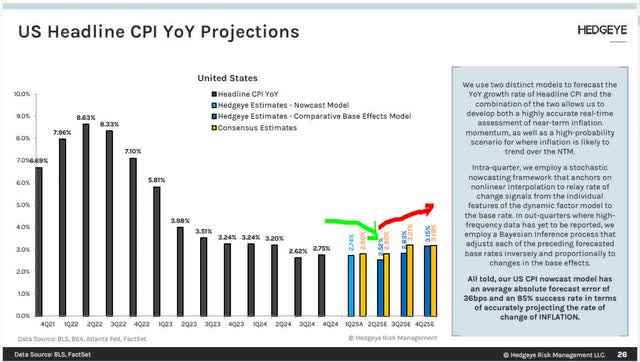
When market participants start to anticipate this reacceleration, securities will react: some winners will become losers and vice versa. We aim to tilt the portfolio accordingly.
Market Signals
The rebound in positive market internals post the November 2024 election was short lived. With a seemingly exhausted rally in the Mag7 and the uncertain introduction of tariffs, US equity markets moved into “risk off” mode. Interestingly, it is only an increase in selling pressure that is damaging internals. Buying power has remained constant through the turbulence.
Figure 5 – https://www2.lowryondemand.com/members/markets/marketchart.cfm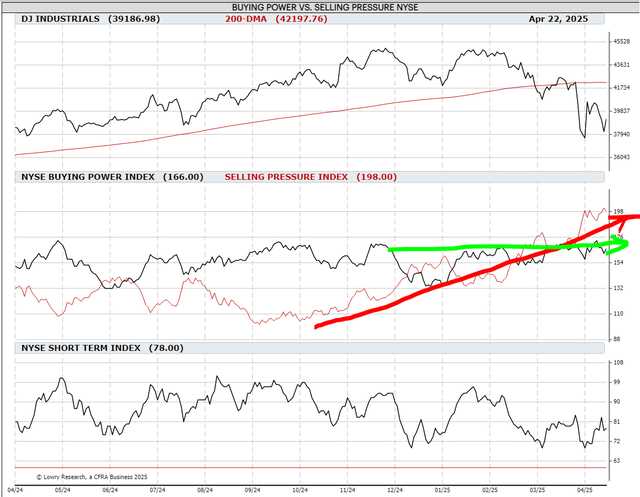
Analyzing these internals, Lowry Research wrote this in their latest weekly missive:
Thus far in April, the market has exhibited great volatility. However, rather than suffering random spasms, a series of days of urgent selling were followed by days of urgent buying to imply that Supply was exhausted and Demand was beginning to return. The chain of events was not typical of major correction bottoms, but there was enough evidence to suggest that the worst was over, and the ball is now in the bulls’ court.
In other words, we may have seen the worst and need to watch market signals carefully, but the atypical pattern means uncertainty remains.
Gold
In periods of uncertainty, particularly “stagflationary” uncertainty, gold thrives. This has clearly been the case since early 2024. Gold has been our largest position (into the low teens across three securities) for most of the first quarter. Given the parabolic move, we recently trimmed the position to the high single digits. Still a large position, gold remains a critical ballast in our portfolio today.
Figure 6 – Gold (www.tradingview.com)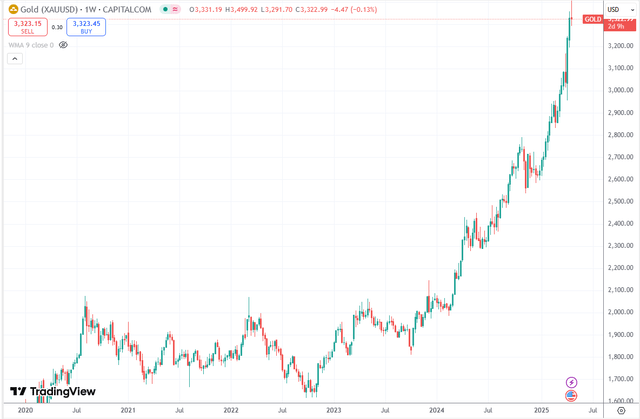
Current Positioning
Our current portfolio composition is more defensive (and has been for much of 2025) than it was in late 2024. Our only commodity related position is a very small exposure to pipeline businesses (more consistent toll bridge than levered to the price of energy). We still have some exposure to large capitalization US equities, but today our equity exposure is more idiosyncratic. We own specific countries that have accelerating growth and US equities that are defensive in nature. Our fixed income exposure is to the short-end of the curve and tilted to higher quality. Our cash position is in the mid-teens. In summary, the portfolio remains “all- seasons” with a defensive posture. This is the way to navigate uncertainty, fly through turbulence, and mitigate the impact of “air pockets.”
As always, if you have any thoughts regarding the above ideas or your specific portfolio that you would like to discuss, please feel free to call us at 1-888-GREY-OWL.
Sincerely,
Grey Owl Capital Management
|
Footnotes 1 We use exchange traded fund (ETF) for performance: MAGS for the Magnificent Seven and IWM for the Russell 2000 small capitalization index. The Mag7 includes Alphabet, Amazon, Apple, Meta, Microsoft, Nvidia, and Tesla. 2 60/40 index refers to 60% MSCI ACWI Index (equity) and 40% Barclays Aggregate Bond Index (bonds). 3 From TradingView: “The 5 Year TIPS/Treasury Breakeven Rate is calculated as the difference between the 5 year treasury rate and the 5 year treasury inflation-indexed security rate. Market participants use this value as what they believe the expected inflation should be in the next 5 years, on average.” This newsletter contains general information that is not suitable for everyone. The information contained herein should not be construed as personalized investment advice. Past performance is no guarantee of future results. There is no guarantee that the views and opinions expressed in this newsletter will come to pass. Investing in the stock market involves the potential for gains and the risk of losses and may not be suitable for all investors. Information presented herein is subject to change without notice and should not be considered as a solicitation to buy or sell any security. Any information prepared by any unaffiliated third party, whether linked to this newsletter or incorporated herein, is included for informational purposes only, and no representation is made as to the accuracy, timeliness, suitability, completeness, or relevance of that information. The stocks we elect to highlight each quarter will not always be the highest performing stocks in the portfolio, but rather will have had some reported news or event of significance or are either new purchases or significant holdings (relative to position size) for which we choose to discuss our investment tactics. They do not necessarily represent all of the securities purchased, sold or recommended by the adviser, and the reader should not assume that investments in the securities identified and discussed were or will be profitable. A complete list of recommendations by Grey Owl Capital Management, LLC may be obtained by contacting the adviser at 1-888-473-9695. Grey Owl Capital Management, LLC (“Grey Owl”) is a Virginia registered investment adviser with its principal place of business in the Commonwealth of Virginia. Grey Owl and its representatives are in compliance with the current notice filing requirements imposed upon registered investment advisers by those states in which Grey Owl maintains clients. Grey Owl may only transact business in those states in which it is notice filed or qualifies for an exemption or exclusion from notice filing requirements. This newsletter is limited to the dissemination of general information pertaining to its investment advisory services. Any subsequent, direct communication by Grey Owl with a prospective client shall be conducted by a representative that is either registered or qualifies for an exemption or exclusion from registration in the state where the prospective client resides. For information pertaining to the registration status of Grey Owl, please contact Grey Owl or refer to the Investment Adviser Public Disclosure web site ( www.adviserinfo.sec.gov). For additional information about Grey Owl, including fees and services, send for our disclosure statement as set forth on Form ADV using the contact information herein. Please read the disclosure statement carefully before you invest or send money. |
Original Post
Editor’s Note: The summary bullets for this article were chosen by Seeking Alpha editors.
#Grey #Owl #Capital #Management #Client #Letter