Oselote/iStock via Getty Images
Letter Summary
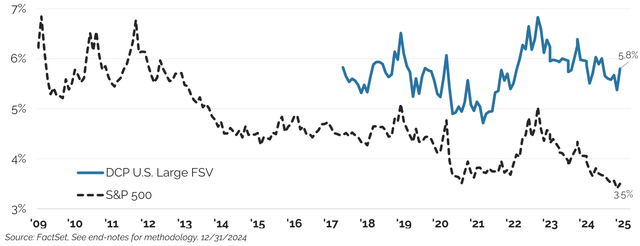
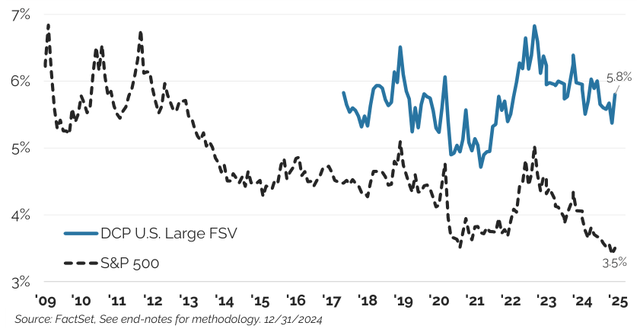
Large U.S. equities, as measured by the S&P 500 Index (SP500,SPX), are up 43% since the October 2023 low, while underlying rolling next-twelve- month consensus estimated free cash flows (NTM FCF) have increased by just 9.G%. This disconnect between prices and fundamentals is most acute for just a handful of the largest stocks. While Nvidia (NVDA) experienced enormous growth which accounted for nearly a third of the overall market’s increase in expected free cash flows this year, many companies saw much more modest fundamental improvements while still experiencing substantial stock price appreciation. Given the enormous weight of the biggest stocks where this has occurred, the overall market has become much more expensive and there looks to be considerable valuation risk for large U.S. stocks in aggregate as a consequence. We believe this will be a critical risk for investors to navigate in the coming years. Our U.S. large cap strategy is doing this by remaining disciplined on valuation and taking advantage of attractive opportunities outside of the small handful of the biggest U.S. stocks. Consequently, the strategy’s free cash flow to enterprise value yield of 5.8% is now at a record premium to the S&P 500’s 3.5% (see Figure 1 below). Our small cap U.S. and international strategies, which respectively offer free cash to enterprise value yields of 9.1% and 7.7%, also offer very attractive valuations compared to the richness of the broader U.S. equity market.
Performance Summary
U.S. Fundamental Stability M Value (U.S. FSV): Amid significant valuation expansion in the broader U.S. equity market, Distillate’s U.S. FSV strategy’s total return of 12.84% trailed the broader S&P 500’s gain of 25% during the year. The strategy performed more similarly to the Russell 1000 Value ETF’s total return of 14.35% over the period. Annualized net of fee performance since inception is 0.40% ahead of the S&P 500 and 5.G9% ahead of the Russell 1000 Value ETF.
U.S. Small/Mid Cap Quality M Value (SMID QV): Our SMID QV strategy lagged the Russell 2000 and Russell 2000 Value benchmarks by 8.G% and 5.1% in 2024. After significant outperformance in prior years, annualized excess returns since inception and net of fees are G.3% and G.4% ahead of those benchmarks.
International Fundamental Stability M Value (Intl. FSV): Our International FSV strategy returned -0.25% after fees during 2024 and trailed the MSCI All Country Ex US ETF benchmark gain of 5.19%. Annualized net of fee performance since inception is around 20 basis points behind the benchmark return.
U.S. Large Cap Value Long 130%/Short 30% (U.S. Value 130/30): Our 130/30 strategy, which by design produces more variable performance, returned 13.34% net of fees for the year vs. the S&P 500 Index’s comparable rise of 25%. This strategy is 2.4% ahead of the S&P 500 Index on an annualized net of fee basis and above the Russell 1000 Value by 8.2% since inception.
Figure 1: S&P 500 Next Twelve Month Free Cash to Enterprise Value Yield vs. Distillate’s U.S. FSV Strategy
Market Commentary
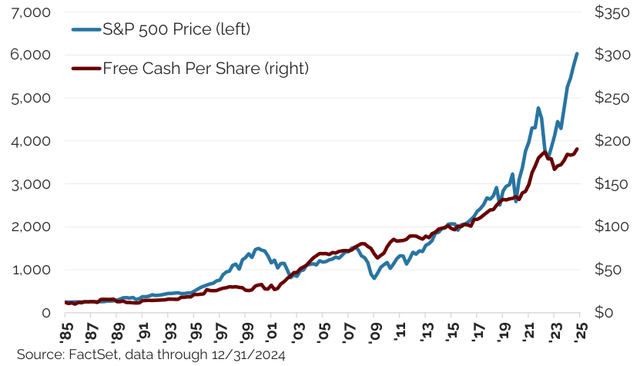
The S&P 500 Index rose by more than 20% in back-to-back years for the first time since the tech bubble. The strong rally over the past two years has been driven by valuation expansion as price gains have considerably exceeded growth in trailing free cash flow per share (See Figure 2). The divergence between the two echoes a similar gap that occurred in the late 1990s.
Price increases for the SfiP 500 continue to exceed free cash flow gains.
Figure 2: S&P 500 Price vs. Trailing Free Cash Flow
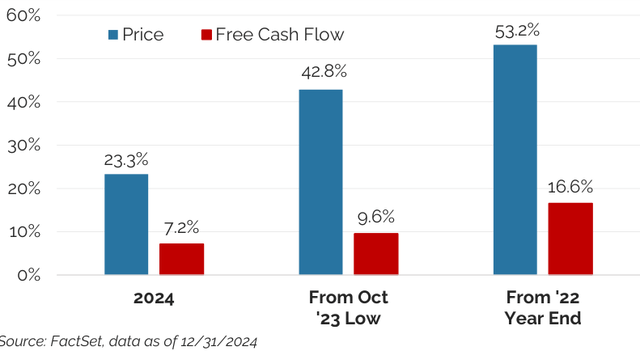
The disconnect between prices and fundamentals is also stark when using forward estimates for free cash flows which reflect the benefit of expected future growth. Figure 3 highlights the wide gap between recent changes in price and estimated next twelve-month (NTM) free cash flows from certain key dates. Free cash flow gains in these periods have been healthy and were driven in large part by the enormous increase at Nvidia, which accounted for almost a third of the total in 2024 and since 2022. But price gains far exceeded this improvement in underlying fundamentals with the result that valuation expansion has accounted for the majority of price changes and the market’s valuation now looks expensive in a historical context. The 2024 year-end free cash flow to market cap yield of 3.9% is rich and well below the 4.5% where it started the year and the 5.4% average going back to 2008 when forward estimates first became available.
S&P 500 price gains have considerably exceeded free cash flow gains.Figure 3: S&P 500 Price vs. Est. NTM Free Cash Flow
Valuation risk is concentrated as just 15 mega-cap (over $250 billion) stocks that account for almost 40% of the total market are trading at a 83% premium to the rest of the S&P 500.
Figure 4: Free Cash (NTM) Valuation of the Richest Megacap 15 Stocks vs. the Rest of the Market
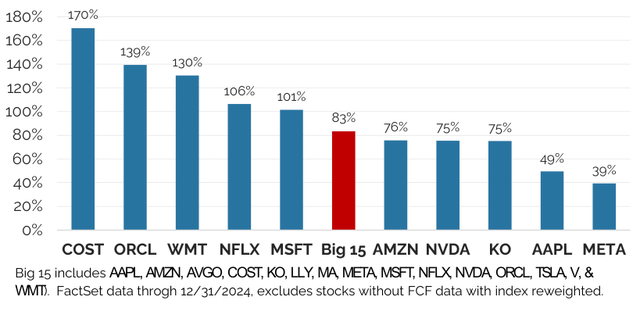
While the broader U.S. equity market looks expensive, this masks a more nuanced story below the surface. Much of the valuation risk in today’s market in our view is concentrated in relatively few names. The most expensive 15 stocks with market capitalizations over $250 billion are currently trading at an 83% premium to the rest of the market. This is shown in Figure 4 which depicts the valuation for a select number of these stocks as well as that of the full group of 15 relative to the rest of the market. In addition to their richness versus the rest of the market, these stock also stand out in sheer size as they now collectively account for almost 40% of the total market capitalization of the S&P 500–an enormous degree of concentration among a small group of expensive stocks.
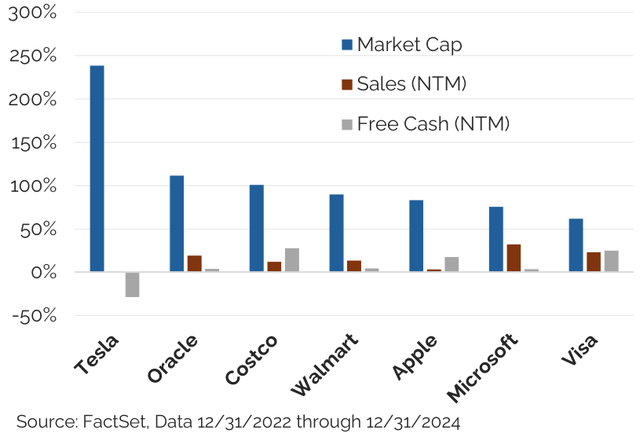
While Nvidia stands out in this group for having extraordinary underlying fundamental growth supporting its rise in value, for many of the other stocks this has not been the case. Figure 4 below compares the change in market cap versus consensus estimated next twelve-month sales and free cash flows for a number of companies in this group, and highlights the disparity between recent price and fundamental changes. This disconnect has propelled valuations to the very rich levels seen in the previous chart and indicates and extraordinary level of optimism around the stocks.
Prices and fundamentals have diverged for many of the biggest stocks.
Figure 5: Change in Mkt Cap, Sales, & FCF Since YE ‘22
This is not to say that the companies behind these stocks are not remarkable businesses and they may well see continued success. The issue rather is that an enormous amount of success priced into their stocks. This is crucial as investing is not so much about what happens in the future, but what happens relative to what is expected and discounted in the share price. Given current valuations, this group collectively looks to have significant price risk even in scenarios where fundamentals remain quite healthy.
Nvidia is worth touching on as it was the single largest driver of the market’s return in 2024 contributing an incredible almost G% of the 25% total. Amid a frenzy in demand for powerful chips set off by the ChatGPT launch in November of 2022, Nvidia has experienced extraordinary growth in sales and an even greater increase in profits as pricing power has enabled EBITDA margins to surge to nearly 70%. In a notoriously cyclical sector, this poses two concerns about the sustainability of record profits. First, sales may begin to moderate or even decline if either demand for AI chips broadly slows down or if increased competition erodes Nvidia’s market share. There are indications that this is already beginning to happen as record profits and margins have attracted competitors including many of Nvidia’s own largest customers. Margins that have been supported by insatiable demand and little competition thus far may also prove less sustainable in an environment of more modest topline growth and greater competition. Though Nvidia stands out among the group of the biggest most expensive stocks for its extraordinary fundamental growth, we worry that it too may be pricing in a very optimistic future of continued significant sales growth and sustained high margins with little room for disappointment.
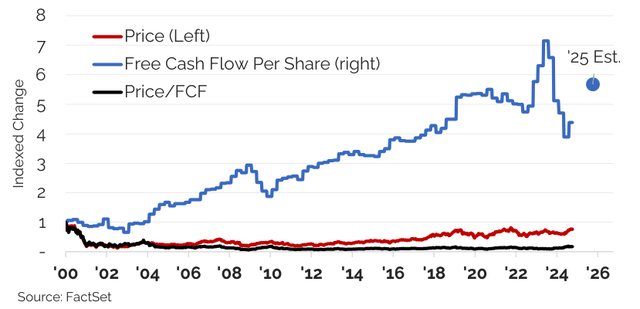
Cisco offers the ultimate cautionary tale about the risk of overpaying for a stock even when fundamentals are healthy. Investors in 2000 were rightfully optimistic about the company’s prospects as it grew free cash flows solidly over the coming 24 years. The mistake they made was to pay nearly 120x trailing free cash flows for the stock. The compression in that valuation multiple has more than swamped free cash growth since then and the stock price is still below its 2000 peak despite the enormous growth in free cash flow since then (See Figure 6).
Investors in Cisco stock in 2000 were correct to be optimistic about future growth, but vastly overpaid and the stock remains below its 2000 peak.
Figure 6: Cisco Price, FCF, and Multiple Indexed to 2000
U.S. Large
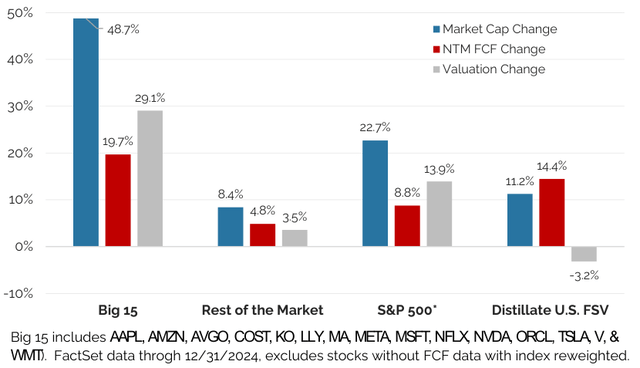
The biggest driver of returns versus the broader market as measured by the S&P 500 ETF were the expensive mega-cap stocks that Distillate did not own due to our focus on valuation. To analyze this impact, Figure 7 separates this group of stocks from the rest of the market and deconstructs prices gains in 2024 into changes in rolling next twelve-month consensus estimated free cash flows and valuation.
For the Big 15, price was up almost 50% while free cash flows rose 20% (10 percentage points of which came from Nvidia alone). Valuation expansion made up the remaining nearly 30% of the total return. For the rest of the market that had available free cash flow data, the price rise was a much more modest 8.4%, with a 4.8% increase in free cash flow and a 3.5% rise in valuation.
The combination of these can be seen in the third set of columns with a roughly 23% price increase for the broader S&P 500 (excluding stocks without free cash estimates and based on year-end constituents) driven by an 8.8% increase in free cash flows and a 13.9% valuation expansion.
Distillate’s U.S. FSV portfolio is shown in the right-most columns and differs notably from the broader market in that it lagged in price with just an 11.2% increase (excluding dividends) but had a 14.4% increase in underlying free cash flows—a figure that actually well exceeded the comparable measure for the overall market. This, however, was offset by valuation compression as the free cash yield on Distillate’s portfolio actually became more attractive while the market became considerably richer.
The free cash flows underpinning Distillate’s large cap portfolio rose by more than those for the overall market, but Distillate lagged in price as it experienced valuation compression while the broad market’s value rose.
Figure 7: Price, Free Cash Flow, and Valuation Changes in 2024 for the S&P 500, Big 15, and Distillate
While the underperformance versus the broader market in 2024 was frustrating, our value-driven U.S. FSV portfolio behaved as designed by avoiding expensive stocks and taking advantage of the attractive valuation opportunities that became available in high quality stocks. Painful as it can be, we would expect the strategy to lag in such an environment. The greater than market increase in underlying free cash flows for the strategy indicates that it functioned as constructed and that underperformance was driven by a lack of participation in valuation expansion in a market that has become considerably richer and looks fairly risky in this regard (for more, please see our recent white paper on Asset Class Valuations).
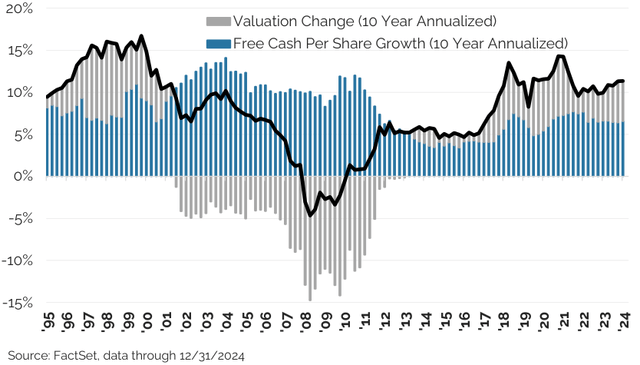
In the longer-term, underlying fundamentals drive returns. In the short term, however, valuation changes can be significant and create a real sense of missing out. This is evident in Figure 8 which shows 10-year S&P 500 returns split by valuation and free cash flow 6% changes. It shows that free cash flows to be the much more stable component of price gains and valuation changes being fickle — Mr. Market, ala Ben Graham, is alive and well. The chart also highlights how valuation changes often swing positively or negatively for multi-year periods. By focusing on high quality companies and rebalancing into attractive valuation opportunities, our intention is to produce attractive long-term returns that are generated by strong underlying free cash flow growth and to avoid the big cyclical swings that can come from valuation changes.
Over rolling 10-year periods dating to when free cash flow data flrst became available, free cash flow changes were the more stable component of annualized price changes and valuation was more volatile.
Figure 8: 10 Year S&P 500 Price Changes Split into Free Cash Flow and Valuation Changes
With increasingly rich valuations for the broader market, Distillate’s valuation difference to the market has widened considerably and is now at the greatest numerical advantage since the strategy began. The free cash flow yield to enterprise value for Distillate’s large cap strategy was already at a significant premium to the market at the start of the year, but that widened further as the free cash flows underpinning our strategy increased by more than those of the market and our strategy saw its free cash yield rise as the market’s fell. This is evident in Figure 9.
It is also notable that Distillate’s free cash to enterprise value yield is at the same level that it was when we started the strategy 7 years ago, while the market’s yield has fallen by over 22%. Our outperformance versus the market over that full period has thus occurred in spite of an enormous valuation headwind. This results from the combination of fundamental performance for the strategy’s underlying holdings in combination with the benefit that comes from rebalancing into less expensive stocks.
The NTM free cash to EV yield for Distillate’s U.S. FSV remains roughly where it was when the strategy began while the SfiP 500’s has fallen sharply with the result that the valuation differential is extremely wide.
Figure 9: Free Cash to Enterprise Value Yield for Distillate’s U.S. FSV Strategy vs. the S&P 500
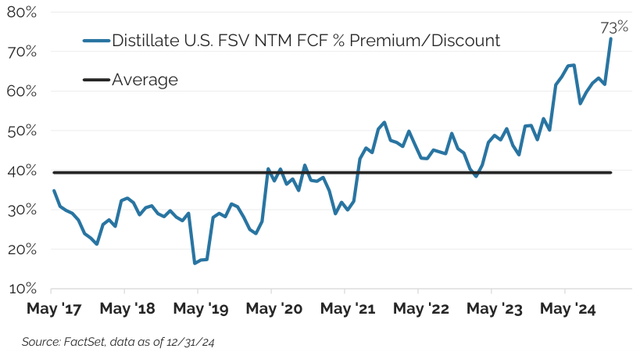
The free cash flow yield to market cap difference between our strategy and the S&P 500 is also at a record. This is evident in Figure 10 which plots the free cash to market cap yield premium of Distillate’s U.S. FSV strategy over the S&P 500. Our U.S. FSV strategy has averaged around a 40% free cash flow to market cap yield advantage over the broader market, but as the overall market started to become much more richly valued in the last two years, this premium widened out and just hit a record high of 73%. While the market is clearly less focused on valuation at present, at some point we believe this will shift as has been the case in past, and we are optimistic that this valuation spread will be of great benefit over time.
The NTM free cash to market cap yield for Distillate’s U.S. FSV is at a record premium to that of the SfiP 500.
Figure 10: Free Cash to Market Cap Yield for Distillate’s U.S. FSV Relative to the S&P 500
Small/Mid
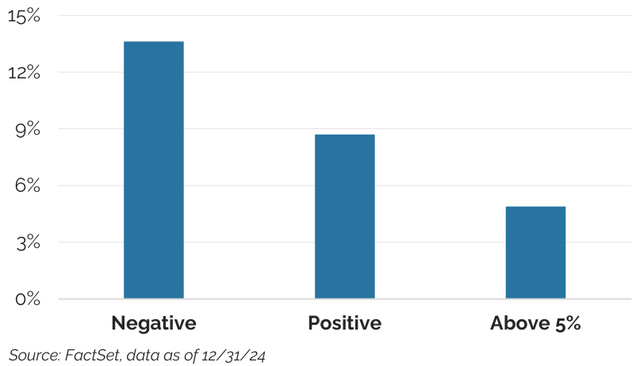
After a slow start to the year, smaller U.S. stocks came to life in July. It’s difficult to discern what the catalyst for this was, but the rally among small stocks appeared to be indiscriminate. What we found interesting about this small company move was the degree to which the lower quality companies performed better than what we would consider higher quality companies. Figure 11 highlights this dynamic by showing how starting valuation related to full year returns. Russell 2000 stocks with negative free cash yields at the start of 2024 had stronger average returns than stocks with positive free cash yields and among the stocks with positive yields, the most attractively valued ones performed the worst.
Distillate’s Small/Mid QV’s holdings have both low leverage and high free cash yields while the rest of the small cap market is highly scattered.
Figure 11: Russell 2000 Starting Year NTM Free Cash to Market Cap Yield vs. Average Return
This environment in which lower quality (or negative earning) and more expensive stocks did best was challenging for our strategy that emphasizes valuation and quality. Over the longer-term, however, we firmly believe that emphasizing these attributes is the correct approach and despite lagging in 2024 the strategy remains ahead of the Russell 2000, annualized after-fees, since it began in 2019.
Just as we are finding opportunity among the smaller stocks within the large cap space given the richness of many of the biggest companies, we are also seeing very compelling valuations among smaller stocks generally. Broader indexes of small stocks, however, are heavily exposed to unprofitable and highly indebted stocks. Seeking out the attractive valuations among smaller U.S. stocks therefore requires navigation around these key risks. Fortunately, there is enormous dispersion in the small cap space that allows us to circumvent these issues. Figure 12 highlights our positioning across valuation and leverage while also showing the enormous range within the broader small cap market on these measures.
Distillate’s Small/Mid QV’s holdings have both low leverage and high free cash yields while the rest of the small cap market is highly scattered.
Figure 12: FCF/EV Yield vs. Leverage by Stock
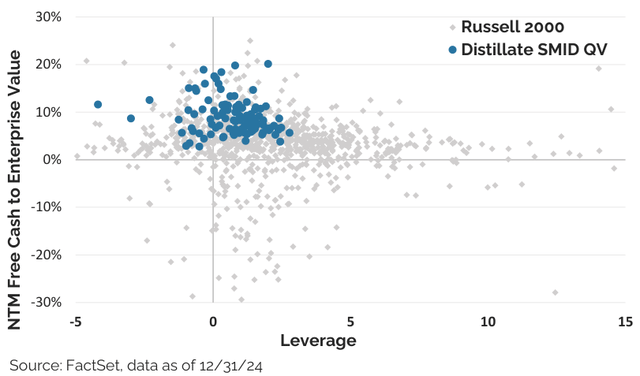
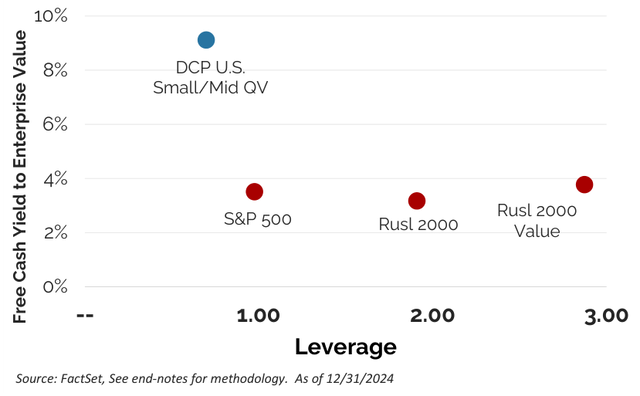
When these individual holdings are aggregated into our Small/Mid QV portfolio, the result is a substantially better valuation and much lower leverage than the small cap or large cap benchmarks (see Figure 13). Note that the small stock benchmarks overall are unattractive, trading at a similar valuation as the S&P 500. This runs counter to much Wall Street commentary which typically relies on P/E-based valuation measures that exclude unprofitable companies and ignores debt.
Small stocks in aggregate do not look especially attractive vs. large stocks when leverage and negative earning stocks are included, but Distillate’s Smid QV strategy does.
Figure 13: FCF/EV Yield vs. Leverage by Portfolio
International
The Distillate International FSV strategy underperformed its benchmark, the MSCI World ex U.S., in 2024 mainly due to its underweight to financials and its overweight to automakers in the consumer durables sector. Financials will generally be an underweight position due to Distillate’s strategies not investing in balance sheet driven banks due to their leverage. When banks perform well, it is typically a headwind for the strategy since banks make up such a large portion of the Financials sector in the index.
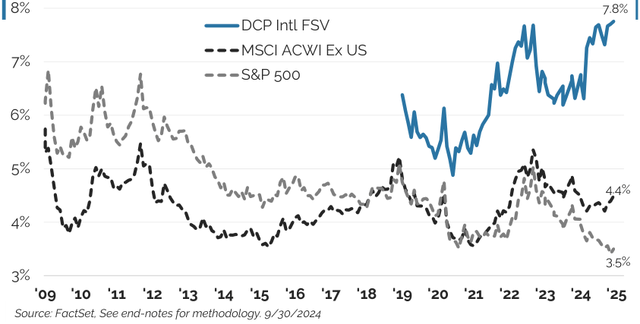
When we compare valutaions, international stocks look more attractive than U.S. large-cap stocks. International look more attractive. Fifteen years ago, international stocks were more expensive than U.S. stocks on the basis of a free cash flow yield. They also had more debt, a legacy of less stable cash flow generation, and faced slower growth. In combination, this made the U.S. market look like the clear winner from an investing perspective despite much commentary to the opposite. Now, after a long period of underper- formance, international stocks are finally more attractively valued than U.S. stocks and the gap between the two widened sharply in 2024.
The history of overall U.S. and international valuations as well as that of our own strategy are shown in Figure 14. International stocks do still have more debt and less stable cash flow profiles, but again those risk can be reduced by filtering out highly levered or fundamentally less stable stocks as our investment process does. Recognizing we risk being the proverbial broken record, we believe being selective is critical in improving the probability of success over the long term by gravitating to those stocks that are the least expensive that meet our quality criteria.
Distillate’s Intl. FSV’s FCF/EV yield is well above that of key benchmarks.
Figure 14: Free Cash to EV vs. Leverage for Distillate’s
Final Word
The equity market, by nearly any measure, is expensive and concentrated—exceptionally so—which is a combination that requires a lot to go right in order for investors to do well. For the markets generally, we rarely see the break between fundamentals and prices that we are witnessing currently and since we know how those episodes have typically ended, we are cautious.
What is perhaps more interesting and less anticipated is the pricing of good companies below the surface. As we noted earlier, the free cash flow yield on our large cap strategy at 5.8% is the same level it was when we began in 2017, and while a bit of a market roller coaster since, the S&P 500 is up 177% since then and we are up 185%.
We also know what we don’t know. We have little ability to predict what will happen in a year or two or even five. Instead, we focus on fundamentals. Regardless of how much the market is willing to pay for certain stocks or a particular theme, we will always search out the high quality companies at valuations that should offer both downside protection and upside opportunity. In an environment where the broader market is as expensive as it is now, we would hope that our process results in meaningfully differentiated valuations for our portfolios, as is the case. Historically, being disciplined on valuation has been rewarded in rich markets and we are optimistic that this will hold true again. Timing such a shift, however, is impossible. Our attention therefore exclusively remains on finding high quality companies at attractive prices and this will never change regardless of the market backdrop.
#Distillate #Capital #Letter #Investors