Urupong
As 2024 comes to an emphatic close, those with exposure to risk assets have a lot to celebrate. It was again a great year to be invested in financial markets. While stock markets generally move in long cycles, the current one (where global growth stocks have outperformed value stocks for over a decade) is exceptionally long by historical standards. With no way to definitively know when one type of market will give way to another, we build our portfolios with what we believe are all- weather companies. We continue to be amazed at the abundance of risk-taking and speculative behavior, particularly in the U.S. The current market environment parallels the Nifty Fifty of the early 1970s and the Tech Bubble of the late 1990s/ early 2000s, both of which preceded difficult bear markets.
Given the backdrop, we believe prudence is necessary, with particular attention paid to valuation and downside protection. Both are key tenets of FMI’s investment process, which celebrates 45 years in 2025. We are optimistic for this year and beyond, in part because our portfolios look very different than the market. We can sleep well at night owning competitively advantaged businesses with strong balance sheets, and portfolios that trade at a significant discount to their respective benchmarks. Our team is closely aligned with our investors, and we are confident valuations will eventually reflect economic reality over the long-term.
Before we walk through a handful of eye-opening market anecdotes below, we are excited to announce the launch of the FMI Global Equity Strategy in 2024. It consists of a diversified portfolio of our highest- conviction ideas from both the FMI Large Cap Equity and FMI International Equity strategies. Additional information can be found here: www.fmimgt.com/ global-equity/
U.S. Equities: Up, Up And Away
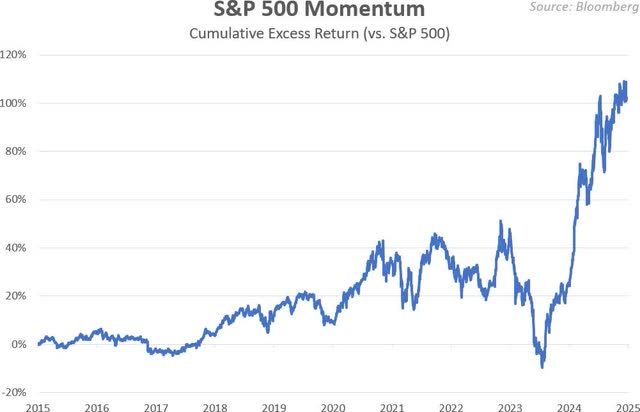
Momentum investing has dominated over the past 2 years, with the S&P 500 Momentum Index outperforming the broader S&P 500 (SP500, SPX) by over 100%, as shown on the right.
Prior to 2018, no company had ever reached a $1 trillion in market capitalization (cap). Since then, 9 have done so. Today, these companies have a collective market cap of ~$20 trillion, equivalent to~67% of the entire GDP of the U.S. In the S&P 500, the top 10 stocks now account for 38% of the index – versus 25% at the peak of the 2000 Tech Bubble. We believe there is much more risk and less diversification in the S&P 500 than commonly acknowledged.
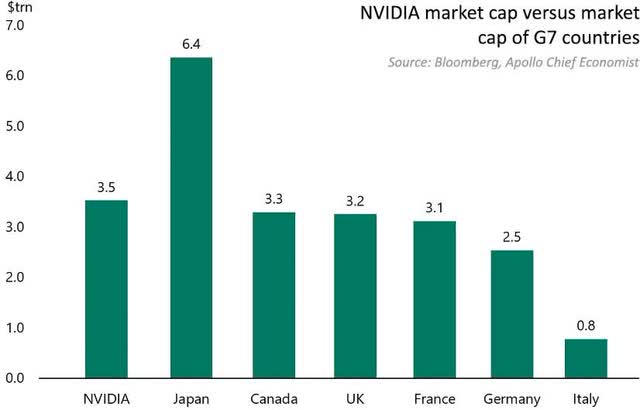
Artificial Intelligence giant Nvidia (NVDA) added over $3 trillion in market cap in less than 2 years. Per the chart on the right, Nvidia’s value recently exceeded the market cap of 5 out of the G7 countries. Not owning Nvidia alone accounted for 40% of FMI Large Cap’s shortfall versus the S&P 500 in 2024.
Just one stock! The company currently trades at an elevated valuation of 57 times trailing price-to- earnings and 32 times price-to-sales. As we have previously articulated, Nvidia’s rapid growth and high margins will continue to attract increased competition (including from some of their biggest customers), which could weigh on future growth rates and returns. We are skeptical Nvidia will meet investors’ extremely lofty expectations.
According to Goldman Sachs, the top 5 performing investment themes in U.S. stock markets in 2024 were: Megacap Tech(+57%), Bitcoin Sensitive(+43%), High Beta 12M Winners(i.e., momentum stocks, +43%), Liquid Most Short(+43%), and Memes(+37%). This list reads like a hot take on TikTok trends. For comparison, Quality Compounders(what FMI seeks to own at discount valuations) were up only 5%.
Growth continues to trounce value in U.S. Large Cap. The Russell 1000 Growth Index outperformed the Russell 1000 Value Index by 19% in 2024, after 31% in 2023. Growth has significantly outperformed over 5- and 10-year periods as well. This remains one of the toughest stretches for value investing in U.S. Large Caps in stock market history.
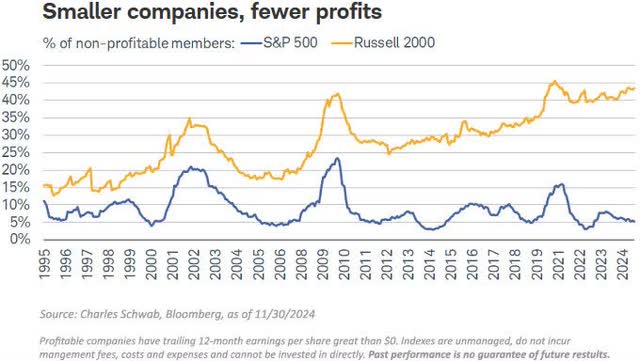
U.S. Small Cap stocks have flashed signs of exuberance, as well. As shown in the top right chart, the number of money-losing companies in the Russell 2000 Index continues to rise (now over 44% of the constituents). In 2024, 139 of these money-losing stocks were up more than 50% on the year, with 68 of these up over 100%. Given the quickly rising levels of speculation, we believe business quality will prove to be especially important.
While value has modestly underperformed growth in U.S. Small/SMID Caps the last couple years, it is far more balanced over the 5- and 10- year periods. The FMI Small Cap Equity Strategy has outperformed significantly over these longer time horizons, as the Small/SMID Cap space has not been dominated by a short list of momentum names.
Pulling Up the Rear: International Equities
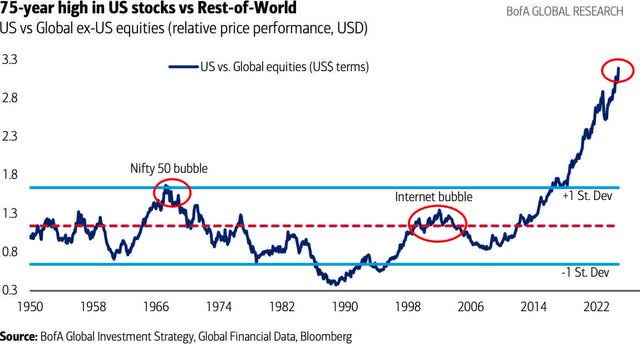
Overseas earnings growth has not kept pace, and valuation premiums in the U.S. compared to the Rest-of-World (ROW) have expanded considerably (now around 2 standard deviations relative to history). While some discount is justifiable, international stocks have been completely left in the dust. The middle chart shows U.S. performance versus the ROW is at a 75-year high, a nearly 4-standard deviation magnitude (approximately 1 in around 16,500 probability).
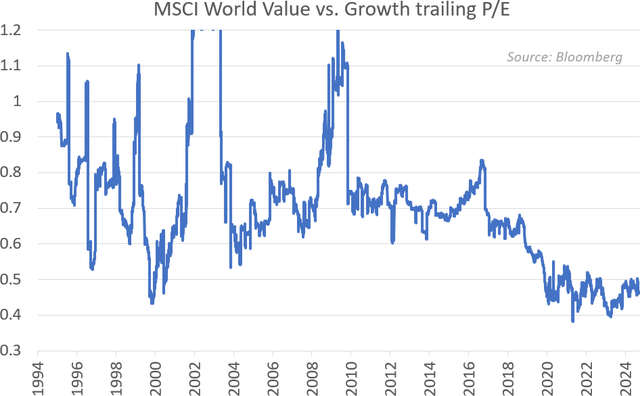
Global value stocks now trade near a 30-year low and a 50% discount when compared to growth stocks (see bottom chart), a starting point that should bode well for contrarian investing. A narrowing of this spread could go a long way towards a resurgence in value stocks.
Notably, not one of the top 45 economies in the world is expected to be in a recession next year, according to Charles Schwab and OECD projections. This strikes us as overly optimistic given the softening economic backdrop in many countries, elevated debt levels, and heightened geopolitical confrontations.
Just Bananas: Crypto, Leverage, and More
At a recent Sotheby’s contemporary art auction in New York, a cryptocurrency entrepreneur paid $6.2 million for a banana duct taped to a wall, which he then ate. Fortunately, he received a certificate of authenticity granting him the right to recreate the artwork. We struggle to see the intrinsic value (and sanity) of this transaction. It does make for good entertainment – though the 2-month-old apple taped to a table in our office has yet to receive any offers.
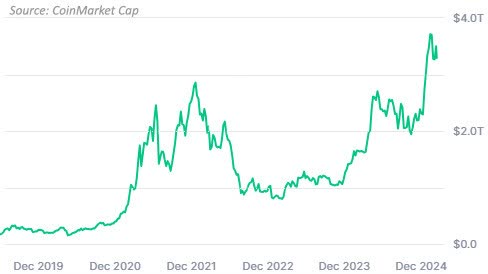
The market cap for cryptocurrencies (see chart below) has ballooned from less than $250 million in 2020 to over $3.5 trillion in 2024 (exceeding the market cap of the entire Russell 2000). Although the lion’s share of the attention is dominated by bitcoin, a couple other eye-opening crypto highlights include: Dogecoin (originally launched as a joke) recently exceeding $60 billion in market cap, and Fartcoin (yes, you read that correctly) passing the $1 billion mark.
MicroStrategy Inc. Cl A (MSTR), a money-losing software business which has raised billions of dollars in debt and equity to buy bitcoin cryptocurrency, is an excellent sign of these crazy times. MSTR has generated a +359% return this year, far exceeding bitcoin (+122%). It recently traded in excess of a 300% premium to the value of its bitcoin holdings. Investors who want some extra juice can even buy popular 2 times leveraged ETFs of MicroStrategy’s stock. As MSTR’s price goes up, the company raises more capital and buys more bitcoin. With over an $80 billion valuation, the company appears wildly overvalued at best. Needless to say, MSTR is not on our watch list.
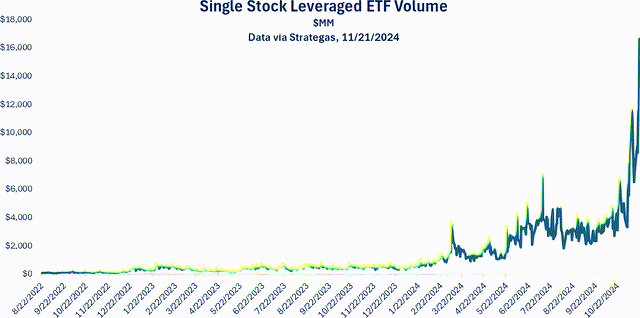
Levered investments are sharply on the rise. Single-stock leveraged ETFs (like the aforementioned MSTR) have sky-rocketed in recent months, as illustrated below. Piling leverage on top of leverage can be a very dangerous game.
U.S. options trading volumes also hit record highs in 2024 (up 37% from 2020), driven in large part by individual retail investors.
Meanwhile, private valuations appear to be bubbling up as well. Grant’s Interest Rate Observer recently wrote that: “Destiny Tech100, Inc., a closed-end fund invested in private tech companies, including SpaceX, OpenAI, and Klarna, trades at a 780% premium to net asset value.” Grant’s also noted that, “There are more than 1,200 startups valued at $1 billion or more afloat, according to CB Insights. Just 1,931 publicly traded U.S. companies are so valued.” The willingness to participate appears to be plentiful no matter where you turn.
Follow the Herd: Flows and Sentiment
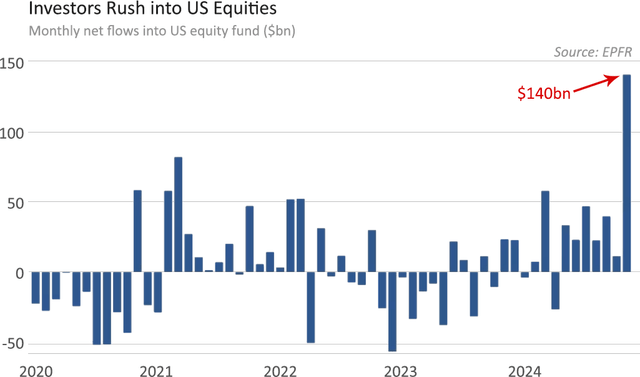
Cash levels fell to a 23-year low in a recent fund manager survey, as investors are piling into U.S. equities (and passive vehicles, in particular) at an unparalleled rate, per the chart. As a reminder, passive investing has no regard for valuation, which clouds price discovery. It speaks to the herd behavior and momentum we are seeing today.
At the same time, credit spreads on high-yield bonds in the U.S. recently reached their lowest levels since 2007, while investment-grade credit spreads have not been this low since the late 1990’s and mid 2000’s. Low credit spreads are indicative of diminished perceived credit risks and high investor confidence, both of which could be coming together at an inopportune time.
Investor sentiment remains quite elevated. According to a recent consumer confidence survey, over 56% of investors expect stock prices to increase over the next year, yet another all-time high. This is more than double the rate from two years ago and compares to a long-run average of 36%. When the good times roll (like they are today), it’s not surprising to see unwavering optimism.
As a reminder, investors will often do the wrong thing at the wrong time (i.e., buy at the top and sell at the bottom). Today, many are likely doing just that: stretching for returns and buying what has been working. As illustrated above, there appears to be no shortage of risk-seeking behavior. There will come a time when greed is replaced by fear (and selling pressure), and FMI will look to take advantage of these dislocations. In the meantime, we will stay the course, continue our relentless search for undervalued securities, and strategically prepare for the market to normalize.
Listed below are a few portfolio holdings where we are finding attractive relative values today:
Donaldson Company Inc. (DCI) – Small Cap/All Cap
Donaldson is a leading global designer and manufacturer of air and liquid filtration products with broad industrial and geographic exposure. The company’s technology-led filtration solutions increase efficiency and lower maintenance costs for customers. We like the durability of the franchise (founded in 1915), mission-critical yet low-cost nature of the products, resilient, growing, and higher-margin aftermarket exposure, attractive return profile, conservative and disciplined management, and solid balance sheet. The business serves many cyclical end markets (construction, mining, agriculture, trucking, manufacturing/production, etc.), several of which are seeing signs of softness, though we expect it to grow above its end- markets with less volatility through the cycle. The valuation is well below the market, which we view as attractive given its above-average business quality.
Progressive Corp. (PGR) – Large Cap/All cap/Global
Progressive is the second largest auto insurer in the U.S. The company is successfully moving up-market through improved bundling with home insurance. They are also a leading player in commercial auto and are increasingly making in-roads in other commercial lines. Progressive has built durable competitive advantages through efficient, low-cost direct distribution, investments in technology and analytics, and scale. This has allowed them to price their products attractively and take market share over time, while still earning above average margins and returns on equity. All indications suggest the company can continue to perform in this manner moving forward. The industry is in the middle of a recovery from a highly disruptive period during the pandemic, which has led to strong top and bottom-line growth for Progressive. The shares have done well as the recovery has played out, yet still trade at a sizeable discount to the market.
Edenred SE (OTC:EDNMF, EDEN FP) – International/Global
Edenred is a leading digital platform for specific-purpose payment solutions. Edenred is most well-known for its meal vouchers business. In this business, employers issue meal vouchers to employees that can be redeemed at restaurants. Employers and employees receive a tax benefit, and restaurants benefit from increased traffic. Edenred receives a fee for managing the network, and also earns interest on the float as employers pay for the meal vouchers up-front. Edenred is the global leader in this business and generates attractive returns. Barriers to entry are high due to network effects. Edenred differentiates on the size of its network, technology capabilities, and trusted brand. The stock has been weak due to the pending implementation of a meal voucher fee cap in Italy and meal voucher regulatory uncertainty in France and Brazil. We expect Edenred to have strong earnings growth for the foreseeable future despite the regulatory pressures. Growth should be driven by increased penetration in the large meal vouchers market and in the other business lines. The stock trades at a low-teens multiple of earnings, which we believe significantly undervalues the business quality and growth prospects.
Thank you for your continued support of Fiduciary Management, Inc.
#Fiduciary #Management #Investment #Strategy #Outlook #Mutual #FundFMIJX