Charnchai/iStock via Getty Images
Dear Investors,
During the second half of 2024, our portfolio was down 1% in Canadian dollars net of fees1 which brings our return since inception to +59.7% in Canadian dollars net of fees. This compares to the performance of the most relevant benchmark index, the MSCI Europe SMID Cap index, which was up 1% in the second half of 2024 and is +29.5% since the date of our inception.
The table below gives you the usual summary of our performance and exposure by strategy bucket for the second half of 2024 and the relevant periods since inception.
|
Time Period |
Return, Net of Fees1 |
Exposures by Strategy Bucket |
|||
|
Total Equity |
Core Value Equity |
Special Situation Equity |
Cash |
||
|
FY 20192 |
2.0% |
41.1% |
36.0% |
5.1% |
58.9% |
|
FY 2020 |
25.9% |
78.1% |
70.6% |
7.5% |
21.9% |
|
FY 2021 |
7.4% |
84.1% |
80.8% |
3.3% |
15.9% |
|
FY 2022 |
-14.1% |
95.6% |
79.9% |
15.8% |
4.4% |
|
FY 2023 |
28.9% |
95.9% |
79.2% |
16.7% |
4.1% |
|
FY 2024 |
4.6% |
97.2% |
74.8% |
22.4% |
2.8% |
|
Total Return, Since Inception |
59.7% |
||||
|
Average3, Since Inception |
9.7% |
83.1% |
70.6% |
12.5% |
16.9% |
|
1 Returns presented are the returns of the Highwood Value Partners Client Composite. 2 Inception on December 9, 2019 3 Average Return presented is the Annualized Return of the Highwood Value Partners Client Composite. |
In this letter, I will provide an analysis of European equities given their sharp underperformance vs US equities over the past one, three and five years. I will then discuss the changes to the portfolio in the past six months and provide a business update. I will then move on to the usual business of summarizing the developments at each portfolio company over the past six months. This is a longer letter than usual which is because I have more to say and I hope you can take the 15 minutes to so required to read it.
Our return in the year was one of our lowest since inception. As you know, my mission as your Portfolio Manager is to turn every dollar of investors capital into five dollars over ten years without taking undue risk. A 5% return in 2024 is below the 17.5% annual return which, if compounded over 10 years, gets us to our target. However, 2024 is one year in a ten-year journey and I am grateful for your confidence and trust in my process. I am also heartened by the progress made in the year to increase the margin of safety in the portfolio as measured by the price to value relationship, which at year end stands at 0.47x. The lower the starting valuation of the portfolio vs intrinsic value, the higher is the forward, expected return. The inverse is also true – the higher the starting valuation for any asset, the lower is the future, expected return from holding it, a subject I will now provide some thoughts on.
A Postcard from ValueLand
As a value investor, sometimes it feels like you may be on a different planet to mainstream thinking. North America in particular is awash with commentary of fortunes made in bitcoin, the AI revolution, the magnificent seven’s inexorable rise and a new age of ‘American exceptionalism’. Since the inception of our strategy2, the broad-based US index, the S&P 500 (SP500,SPX) is up 117% in Canadian dollars. This is the combination of the US Dollar appreciating by 19%3 and the S&P 500 up 98% in USD over that time. As my friends at GaveKal have noted, we are now at a point where the US, with 4% of the world’s population, roughly a quarter of global GDP and a third of global corporate profits accounts for more than 70% of global stock market value. The charts below tell the story well.
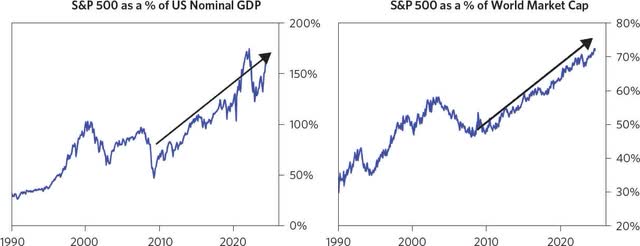
Source: Bridgewater Associates
Our European small and mid cap focused portfolio has lagged this performance, as has pretty much every other equity index outside the USA. The MSCI Europe SMID Cap Index, which is the most similar broad benchmark for our strategy is up 29% in CAD over the same period vs the S&P 500’s +117%. Our strategy, as you know, is up 59% in CAD.
The outperformance of US equities over the past decade is well described in Bridgewater’s report “US Exceptionalism: Drivers of Equity Outperformance and What’s Needed for a Repeat”, which I encourage you to read here. Of course, there is no single driver for the outperformance of US equities. The US has a more widespread shareholder-focused corporate culture than anywhere else in the world, which feeds through to more efficient operations (on average) and better capital allocation (on average). There are many well run, shareholder focused businesses with great capital allocation outside of the US – indeed, these are the qualities I seek in our portfolio of ten to fifteen companies. However, there are simply more of them in the USA. US domiciled companies have also benefited mightily from a supportive policy backdrop for corporate America: tax rates have fallen and the US government has run larger fiscal deficits than the rest of the developed world, which is money that has fed back into corporate profits. But the single largest driver of US outperformance has been the existence and continuing growth of the US Tech sector, represented best by the Magnificent Seven4 . US Tech accounted for more than two thirds of US equity outperformance since 2010 vs the rest of the developed world. This is a combination of the US index being overweight the tech sector relative to other countries, but more significantly, the faster growth, higher margins and higher valuations these companies now command.
The US equity market is now the most highly valued it has been in forty years. The trailing Price/Earnings raio for the S&P 500 is 29x and the Mag7 trade at over 60x earnings. Over the past couple of years that seems to have become normalised, but it is not normal! There are many charts that show how ‘not normal’ this state of affairs is, but this one, which shows US vs European equities since the 1950’s really got me:
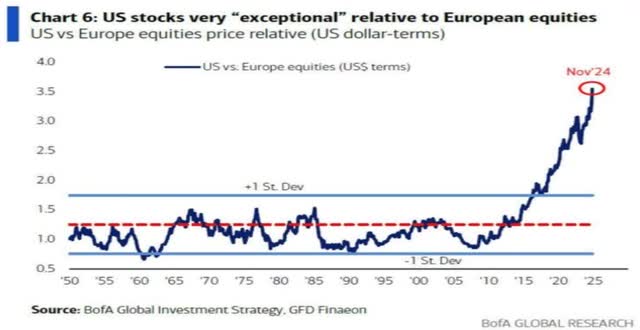
For the 65 years from 1950, the US and European equity markets traded in a range within one standard deviation. This period covers a lot of history: economic recessions, recoveries, wars and changing geopolitics. From 2018 or so, this relationship broke down. As noted earlier, since December 2019, European equities are up 29% and US equities are up 4x that amount. This outperformance is driven bby the ‘US Exceptionalism’ narrative, which is supported by the big US tech companies of the Mag7. Rising prices have a tendency to suck in investors who are fearful of missing out and who are willing to ignore the starting valuations they are buying in at. This has served to perpetuate the ‘exceptionalism’ narrative.
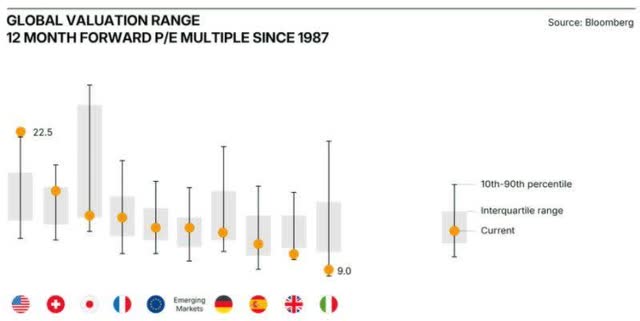
The following chart is a few months old, but it shows the forward P/E of equity markets by geography. The US is noted as being at 22.5x forward earnings (ie. predicted earnings for 2025, not actual). This is at the top end of its historical range since 1987. In contrast, Italy is at 9x earnings which is at the bottom of its historic range and the UK similarly is around 11x, near the bottom of its range.
The starting valuations of US equities entail with near mathematical certainty that their investors face little to no return in the future, and more likely than not, losing money. The question is not whether US exceptionalism will continue, but whether this phenomenon is priced into US equities today. The chart below shows the relationship between starting P/E on the x-axis and subsequent 10yr actual/realised returns for investors on the y-axis:
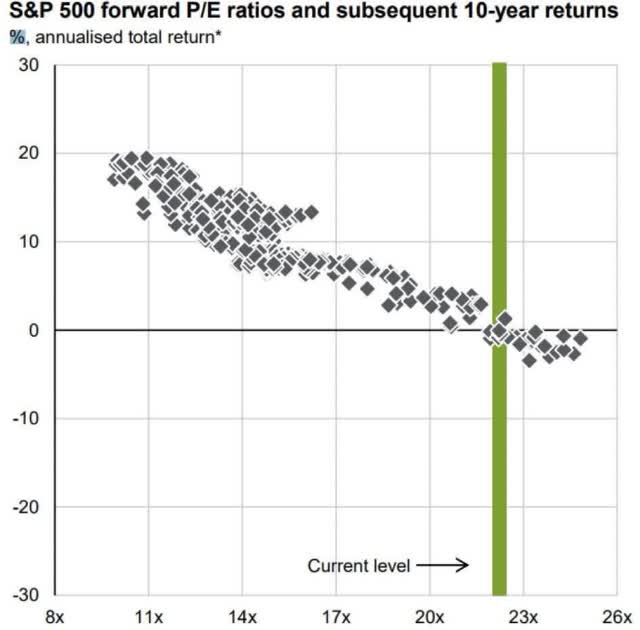
What the chart shows is that 100% of the time when forward P/E ratios on the S&P 500 have been at the current level, investors subsequently made a zero or negative return over the next 10 years. Regardless of how compelling the narrative was that drove valuations to those levels, the empirical fact is that it did not matter. Returns were zero or less over a ten year period – a lost decade for returns. Take a moment to let that sink in.
In contrast, when the starting P/E was 11x or lower, the 10yr forward returns were between 15% and 20% per annum. Taking the midpoint of 17.5%, that means investors made 5x their money over the subsequent 10 years if they did not sell. The inevitable conclusion is that valuation matters more than narrative for future returns.
Now, in contrast to the US, select markets in Europe are at all time low valuations. This is reflected in our portfolio, which has a median P/E of just over 8x. This group of businesses have grown revenue at 12% annually 5 over the past years at 21% returns on capital despite a pandemic, a war in Europe and macroeconomic headwinds. I continue to believe that Europe is a happy hunting ground for mispriced quality businesses.
It is also worth noting in this context that just because our businesses are listed on European exchanges does not mean their businesses are exclusively in Europe. Indeed, our portfolio companies generate 44% of their revenue from the US or in US dollars6, and a lesser 42% of revenue from the UK and continental Europe. To me, owning these businesses priced on European exchanges is a smarter way to own exposure to US exceptionalism without paying up for it.
My ‘postcard from Valueland’ reads as follows: I will continue to execute our value-focused, business owner approach to investing with diligence and patience. Buying great businesses at attractive valuations entails lower risk of loss and higher returns in time than investing on the basis of any narrative. I made a few changes to the portfolio in the last six months which I will now provide some detail on.
Changes to the Portfolio in H2
In Q3 of 2024, I sold our positions in STO SE and Naked Wines (OTCPK:NWINF) and re-deployed the capital, plus additional cash, into the shares of Fevertree Drinks PLC (OTCPK:FQVTF) and HelloFresh SE (OTCPK:HLFFF).
I sold our position in STO as it became clear to me that the business had lost market share over the past year. After conversations with management, I also came away with a lack of confidence in their ability to manage costs if this continues. I sold our position in Naked Wines as I felt I had given the situation sufficient time to show improvement and there was a better use of our capital in a higher quality but similarly beaten down business that was showing improvement (HelloFresh SE).
I believe these changes provide an upgrade to business quality and management alignment in the portfolio. Both Fevertree and HelloFresh are high quality, profitable businesses, with growing competitive advantage, consistent market share gains and no debt, run by founder-led management teams. They have both fallen out of favour in the equity market for understandable but what I believe to be short-term reasons that we will look back on as being bumps in the road. I expect us to make our return as the fundamentals of these businesses continue to improve and investors start to look beyond the next few quarters.
Fevertree Drinks PLC – Core Value
Fevertree Drinks is the London listed beverages company best known for pioneering the premium mixer category under the tag line ‘if three quarters of your drink is the mixer, mix with the best’. Fevertree is a brand with pricing power and it has come to dominate its category in the UK and in every major geographic market it has entered, including the USA and Canada, where it is now the market leader in tonic water and ginger beer. It was founded in the UK in 2004 by current CEO Tim Warrillow and Charles Rolls.
Today, it’s largest market is the USA (35% of Revenue). The UK is 30% of revenue, Europe is 25% and the rest of the world, including Canada and Australia are 10% of revenues. It is an excellent business with no debt run by the founder who owns over $100mn worth of stock. The shares are down 75% over the past 3yrs due to increased cost of goods sold (mainly glass and trans-atlantic shipping rates). My thesis is that the issues that caused these higher cost of goods sold are transitory, and management are doing the right things to put them in the rear-view mirror. If they are successful, which I believe they will be, we will end up owning a high quality, branded beverages company for c.8x unlevered earnings. In my view, this is a steal and sets up expected returns well above our hurdle rate. Further, my thesis is that we are likely to make a good return even if current management struggle to execute. There is no shortage of larger beverage companies that would like to get into the categories that FEVR dominate, and acquiring the brand would be the obvious way of doing so. All of these larger beverage companies could solve FEVR’s cost and logistics issues with the stroke of a pen and would have the ability to distribute the FEVR products down a wider distribution network with greater marketing scale and support. The synergies would be substantial as is reflected by historic transaction multiples of brands that can be bolted onto an existing portfolio of over 6x revenue vs FEVR’s current price of 1.8x revenue. Current management and founders are focused on avoiding the scenario where their life’s work is gobbled up by a larger beverages company. Please see the appendix for more detail on Fevertree.
HelloFresh SE – Core Value
HelloFresh is a specialist logistics platform and the global market leader in direct-to-consumer meal kits and ready-to-eat meals. It operates in a large and growing market characterized by intense price competition. Its rivals and many start ups that would compete with it have attracted significant venture and start up capital over the past 10 years in an all too familiar race to acquire scale. This has resulted in a market with heavy price competition, notably in the form of vouchering in a race to acquire customers profitably or not. While this has weighed on profitability, HelloFresh has leveraged its first mover advantage to gain share and now has 75% of the US market, which is 2/3 rds of the group, and 80% market share in international markets. The company now delivers over 1bn meals per annum to affluent, time conscious customers.
HelloFresh has won the race to scale and management are now re-orienting the strategy from a focus on growth to a focus on profitability. The business has economies of scale in procurement, marketing and logistics which means its dominant market share results in lower unit costs than competition. Lower unit costs mean a better deal for customers on like for like product. Its competitors are finding it more difficult to make a profit, some are closing up shop and new capital is less willing to attempt the long and unprofitable journey to gain scale against such a now dominant market leader. Secondly, the management are making use of the data they have accumulated over the past 5 years to determine which customer profiles are truly profitable and which are not. The race to acquire any and all customers to get these scale advantages is coming to an end, and the focus is shifting to generating free cash flow. The two factors together are showing up as lower discounting, lower marketing costs and consequently, expanding profit margins.
Furthermore, HelloFresh is leveraging its logistics platform to offer new services, notably Ready-to-Eat meals (RTE). These meals arrive at your door pre-prepared, are fresher (given a shorter supply chain than traditional grocery) and are tailor made to different consumer tastes. This segment has grown 10x over the past 4 years and is now 30% of the business and growing at 40% per annum with 65% market share in the USA. Group revenue is now just shy of €8bn, 4.3x larger than it was 5 years ago and currently growing at mid single digits per annum.
Despite these developments, the shares have been left for dead. Over the past 4 years, the company generated after tax cash flow of €1.8bn and spent €1bn on production and fulfillment capacity, mainly in the USA7. We acquired our share in the business at a valuation of €0.9bn for the business net of cash or 0.1x revenue. This is a discount to the capital invested in kitchens, distribution and fulfillment centers in the past 4 years alone. To me, this is a bargain for a dominant market leader in a large, growing market with declining price competition and improving profitability.
The business has net cash of €230mn and is run by the founder-CEO, Dominik Richter, who owns $120mn worth of shares. He purchased a further €10mn of shares shortly after we acquired our position in September. The company has also directed some of the excess cash in the business to buy back shares, which is reducing the share count and our proportional ownership of the business.
Business Update
There are a few exciting developments at Highwood. First, I will be consulting with each of you about the prospect of widening our investible universe from Europe-only to all developed markets8. This is by no means set in stone, but it is something I would like to bring up for discussion. The argument for doing so is essentially a corollary of what I have said about the US Equity markets: it makes sense to have the flexibility to go where the opportunities are, and as we have noted, this can vary substantially from one geography to another. It may seem like an odd time to suggest this given the foregoing discussion on ‘US
Exceptionalism’, but I think one of the lessons from the current difference in valuation in one geography versus another is that it is imperative to be flexible across geographies to find the best value. The main argument against expanding the investible universe is that it may take away from my focus, and/or encourage investing outside of my historic circle of competence. After five years running Highwood, I am confident I can manage this risk. The approach I am using is transferable across geographies. High quality, well managed businesses are similar wherever they exist. This is a point of discussion rather than an announcement of a decision taken.
Secondly, as Highwood grows, I will be expanding the team, preferably by one. I have a strong preference for an experienced partner in the vein of the Berkshire Hathaway or Nomad Partnership model. In the shorter term, this may be the role of advisor. This is a positive step for investors as it will provide a second set of eyes on the investment process and scope for greater intellectual debate.
Finally, I thank you for sharing what Highwood is doing with like-minded investors. This has resulted in more incoming interest, much of which is emanating from US investors. I do not have a way for US domiciled investors to invest with Highwood at present, so am exploring options to make this possible. If you are located in the US, and have an interest in Highwood, please feel free to get in touch.
Portfolio Updates:
Below is the usual table which summarizes key statistics on the portfolio as of December 31st. We are 97% invested in the securities of 12 companies. The market price of the portfolio is 47 cents on the dollar of my estimate of intrinsic value, the median P/E is 8.1x and portfolio companies on average have net cash balance sheets (Net Cash/EBITDA of 0.5x).
|
Highwood Value Partners Portfolio |
||||||
|
As of Date |
% Invested |
Median Price / Est. IntrinsicValue |
Median Market Cap,in Mns of USD |
Median NetDebt (Cash) / EBITDA |
Median EV /Sales |
Median P/E |
|
31-Dec-19 |
41% |
0.54x |
550 |
-0.8x |
1.6x |
15.1x |
|
31-Dec-20 |
78% |
0.69x |
713 |
-0.3x |
2.2x |
13.1x |
|
31-Dec-21 |
84% |
0.52x |
1387 |
-0.5x |
2.0x |
13.3x |
|
31-Dec-22 |
96% |
0.45x |
1013 |
0.2x |
1.0x |
10.6x |
|
31-Dec-23 |
95% |
0.54x |
1027 |
-0.2x |
0.9x |
10.7x |
|
31-Dec-24 |
97% |
0.47x |
2008 |
-0.5x |
1.3x |
8.1x |
Below are the updates on our portfolio holdings in order of position size excluding HelloFresh SE and Fevertree Drinks PLC. This section is a little longer than usual as I have included a review of the Borr Drilling (BORR) Investment thesis which was the largest detractor from performance in 2024. Please see the appendix for detail on Borr Drilling.
Burford Capital – Core Value
Burford Capital (BUR) is our UK listed global market leader in litigation finance. The company makes money by funding select commercial litigation claims in exchange for a share of the settlement or court awarded judgement and by generating fees on third party capital as the largest asset manager in this attractive niche asset class. Our investment thesis is available here and details of the judgement against Argentina here.
The market price of our shares in Burford was down 18% in 2024 and flat in the second half of the year9. In contrast, the fundamentals of the business continue to improve in my view. I will briefly update you on these developments split between developments on Burford’s claim against Argentina in the YPF expropriation matter and developments in the core Burford business ex YPF.
Petersen & Eton Park vs Argentina and YPF
The top brass in Argentina seem to be coming to terms with the judgement outstanding against the Republic. President Milei himself admitted publicly that Argentina’s previous administration committed an illegal expropriation of YPF, and stated that “it’s difficult, but we are going to get out of this hole in which the politicians sunk us into [referring to previous PM Cristina Kirchner and Governor Axel Kicillof] and we are going to make Argentina great again”. Jose Luis Espert, a close ally of President Milei and a member of the Chamber of Deputies, the lower house of the Argentine National Congress, also described the situation succinctly when he said in reference to Axel Kicillof, the Governor of the State of Buenos Aires, “[He] nationalized YPF in 2012, knowingly violating contracts, knowing that this was going to result in a lawsuit that Argentina was going to lose for sure. Because when you violate a contract in any civilized country, you lose the lawsuit because you violated the contract that you singed. Is that clear? Its two plus two. You sign a contract, you don’t comply with it, you lose the lawsuit.”
Meanwhile, Argentina’s ability to pay is improving. The Argentine economy is growing, inflation is falling, the government reported its first fiscal surplus in a decade and the interest rate the republic would have to pay to finance itself in US dollars has roughly halved since Milei was elected.
Burford’s enforcement strategy for this judgement is to bring Argentina to the bargaining table for a negotiated settlement. In the words of our CEO Chris Bogart, having a large unsatisfied US court judgement and ongoing enforcement proceedings around the world (which sweep in third parties such as YPF and other Argentine multinationals) is “sand in the gears” for the Republic’s efforts to fulfil President Milei’s economic strategy, which notably includes the privatisation of state-run companies. It will be challenging to convince anyone to buy shares in these companies if Argentina does not show it intends to play by the rules. As a reminder, Burford’s share of this claim alone is $6.8bn or $31/share pre-tax and accrues interest at a rate of $1.64 per Burford share annually. Burford’s current share price is $12.50.
Burford ex the YPF claim
Since inception, Burford has deployed $1.7bn of capital from its own balance sheet on litigation matters sourced through its platform. These investments have resulted in $3.1bn in cash proceeds, for an 84% return on capital and a realized, unlevered cash on cash IRR of 26%10. Burford funds select corporate litigation matters only – it has a loss rate of less than 10% which means it makes money in more than 90% of the cases it funds. This is an impressive track record in my view.
Year to date, the company has realised $380mn from concluded matters, taken in cash receipts of $498mn from those and previous matters and re-deployed $349mn in new matters. Realisations are up 40% year to date. The return on capital from these concluded matters has averaged 98%, or c.2x money in line or better than the historic average. Costs have been well controlled, resulting in operating leverage and increasing returns on capital. Burford has a strong reason to exist and an economic moat as the most reliable partner for corporates who cannot afford to fund credible litigation themselves (for example the YPF matter) or wish to offload this cost to a more experienced partner. We own the shares at 10x earnings and a discount to the run-off value of the book of claims excluding any benefit from YPF.
Protector Forsikring – Core Value
Protector Forsikring (OTCPK:PSKRF) is our mid-cap, Norwegian P&C insurer with a strong corporate culture and a cost advantage in underwriting which feeds a large and growing float. My thesis on Protector is playing out well, and we have achieved a partially realised 5.3x money on this investment and a 5 year 49% IRR. The vast majority of this return has been achieved through Protector’s profitable earnings growth rather than changes in the multiple on those earnings.
Protector’s profitable growth continues. Year to date, the company has grown premiums 12% at an 89% combined ratio. Within this, Protector’s newest market (the UK) is growing faster than the group and is more profitable. The premiums taken in by Protector in exchange for insuring risk create a valuable ‘float’ that can be invested for our benefit as shareholders. As premiums grow so does the float, and as of September it totaled 22.5bn NOK, or roughly $2bn USD. Of this, 85% is invested in bonds with an average A+ rating yielding 5.2%, or c.1bn NOK annually, or a 4% yield on the current share price. The remaining 15% is invested in 30-35 equities with a fundamental value-oriented approach similar to ours. This is a powerful model. We have received 75% of our initial cost back in dividends over the past five years.
Protector has had success replicating its Nordic model in the UK over that time growing from a standing start to 5% market share in its chosen verticals. It is now looking to replicate that success in France, which has a commercial P&C insurance industry dominated by insurers with less focus and higher costs. The company has been studying the French market for a number of years and has decided to proceed with its entry into the market. They have six underwriters focused on France and expect to get to c.20 employees in the Paris office this year. The market opportunity in France is similar to the UK. Protector is copying its winning formula with a focus on shorter duration risks such as commercial motor and property insurance policies which are renewed annually. If successful, this will add a new third engine to Protector’s growth. We own the shares at 12x earnings – the same multiple the shares have been on for most of our holding period.
Borr Drilling – Special Situation
Borr Drilling is our mid-cap, Norwegian listed owner of shallow water drilling rigs and is one of three special situations investments for Highwood. The shares were down 44% in H211 which prompted a full review of the thesis. The initial investment thesis is available here and I include a review of that thesis in Appendix 2. I initiated the position in Q1 of 2022 at $2.73/share. Since that time, the shares have been valued as high as $8.50 in mid 2023 and are currently priced at $3.60. Ultimately, my conviction in this investment has increased and Highwood bought more shares in Q4 as a result. I continue to believe we have a strong margin of safety here and there is a clear path to Borr earning $500 – $600mn in free cash flow versus the current price for the business of $1bn including the convertible bond as equity. This would amount to owning this asset at a 50% free cash flow yield.
Ryanair – Core Value
Ryanair (RYAAY) is our large-cap, Irish listed discount airline able to price its fares at a 30% discount to the costs of competing airlines and still earn a low twenties return on capital in a normalised environment12.
Ryanair continued to take market share, grow volumes and widen its economic moat in 2024. Passenger numbers are up 9% but average fares are down the same amount under the company’s load active/fare passive pricing strategy. This has meant flat revenues in Euro terms so far this year, as compared to the +25% growth in revenues last year. This is not something I am concerned about. What matters for long- term owners of this business is that Ryanair continues to exploit its cost advantage to reduce prices for its customers, which drives further volume growth and market share gains. This is what will result in Ryanair being a larger and more entrenched business in five- and ten-years time.
Ryanair also continues to reduce the number of shares outstanding, so that you own a larger proportion of that business over time. The business’ capital requirements are primarily the purchase of new aircraft, almost exclusively from Boeing. Ryanair invests counter-cyclically and with significant volume to lock in lower prices than its competitors on aircraft, which results in lower ownership costs through the P&L. However, the delivery schedule and final payment for these planes has proven to be lumpy depending on Boeing’s own constraints. In 2024, Boeing faced a significant strike from its workers, which slowed down the delivery of new aircraft to Ryanair. In response, Ryanair had significant excess free cash flow, which it returned to shareholders through two share buybacks and dividends totalling $1.9bn, or 9% of the market cap, while maintaining a net cash balance sheet. The share buyback has resulted in a permanent increase in earnings per share of 7%.
I am very happy to look through a period of lower prices for fares. The business’ competitive moat is widening which is the most important aspect of why we are investors. We own our share of this business at 12x earnings or c.10x earnings in a more normalised fare environment and are partnered with one of the industry’s greatest CEOs of all time.
Bollore and Compagnie de L’Odet – Special Situation
Bollore (OTCPK:BOIVF) and Compagnie de L’Odet (OTCPK:FCODF) are the Paris listed mid-cap holding companies controlled by Vincent Bollore and family. We acquired our shares in H1 of this year, and the thesis (available here) is based on steady compounding of the underlying assets (UMG & Vivendi), value creative uses of the large cash balance and a simplification of the complex family holding structure over our investment horizon. We acquired our ownership in this holding company at 30 cents on the dollar of appraised value and are as well aligned with the Bollore family as we can be given our shareholding in both Compagnie de L’Odet and Bollore SE.
The company has made surprisingly rapid progress in line with our thesis in the past six months. Bollore owns c.60% of itself through a number of subsidiaries – the ‘ex-Rivaud’ entities-which makes the calculation of the true ‘economic’ shares outstanding challenging to determine, and the key reason why the shares trade at such a hefty discount in the public market.
In the past six months Bollore made the largest steps to simplify this structure in a decade. First, in July Bollore SE absorbed one ex-Rivaud entity – Compagnie de Cornouilles – which had owned Bollore SE’s stakes in listed companies Vivendi (OTCPK:VVVNF) and Universal Music Group (OTCPK:UMGNF). Then, Bollore merged four of the ex Rivaud entities into two ‘RemainCos’ (Compagnie du Cambodge and Financiere Moncey). Next, Bollore SE announced a tender offer for the small minorities it did not already own in these two RemainCos and a fifth ex-Rivaud entity, Societe Industrielle et Financiere de l’Artois. Shareholders in these companies were offered either UMG shares or cash from Bollore in exchange. In total, these actions result in the elimination by absorption of five ex Rivaud entities whose main assets were shares in Compagnie de L’Odet, and therefore indirectly shares in Bollore SE. In total, these transactions signal the group’s desire to simplify the ownership structure. This is good news as the more transparent the ownership structure, the clearer is the true economic value of the public shares we own. Further, it sets up the potential for Bollore to start collapsing some of the byzantine Breton Pulley system of holding companies without losing control of Bollore SE. This will return shares in Bollore SE to ‘treasury’ – the hoped for eventual outcome has come a few steps closer.
Finally, Bollore completed the break-up of its second largest listed asset Vivendi SA, the media conglomerate. This was done in part as an attempt to reduce the conglomerate discount of Vivendi and perhaps also to split the group into entities that can each be acquired individually if the returns of doing so for Bollore stack up. Vincent has used every corporate finance trick in the book to grow the per share worth of his family holding company over the past 40 years, and he is at it again.
I do not claim to know the exact path to realisation of value for our shares in Odet and Bollore SE, but we have a strong starting point. In my view, our shares are worth c.3x their current price, we are as well aligned with the Bollore family as we can be, and they are making rapid progress along a path of simplification and value extraction.
Alimak – Core Value
Alimak is our mid-cap, Swedish listed, global industrial business which operates an attractive installed base business model focused on ‘moving people and materials at height’. The company has dominant market positions in industrial and construction elevators, building maintenance units used on high rise buildings and associated safety products. These products have substantial aftermarket requirements which results in a steady annuity like cash flow from service and spare parts, which is protected to a large extent by a large portion of proprietary spare parts and safety requirements. Year to date, revenues and profits are up modestly (+6%) and debt is now down to 2x profits. Growth has been muted by a weak construction market, the result of higher interest rates, which has put a damper on new equipment sales to this end market.
Nonetheless, I am pleased with the progress our CEO, Ole Kristian Jodahl and his team are making with Alimak. They have substantially improved the performance of two underperforming divisions, resulting in higher margins and cash generation and created a more decentralized structure which is bringing Alimak closer to its customers. The next step is a more ambitious growth agenda. The business is supported by several ‘mega-trends’, such as urbanization, increased regulation and safety requirements which all support the long-term growth of the vertical access solutions provided by the group. We own the shares at 15x earnings which is a discount to my estimate of fair value.
JZ Capital Partners – Special Situation
JZ Capital (OTCPK:JZCLF) is our small cap, UK listed closed-end private equity fund in liquidation. Management continue to make progress toward liquidation of the remaining assets in the fund and returning that capital back to shareholders. As a reminder, JZCP owns $170mn in Private Equity assets and $110mn in Cash and has no significant liabilities such that Net Asset Value (NAV) is c.$280mn, or £3.30 per share. Through the equity market we own these assets for c.$170mn, or 60 cents on the dollar at the year end share price. The share price was flat over the year but the company also repurchased 12.65% of our shares at a 58% premium through a mandatory tender offer at NAV. This is how I expect the company to continue returning capital to us and if so, it will be the source of the majority of the return on this investment unless the market re- prices the shares to something closer to NAV. Indeed, in November the company announced a further $30mn of capital will be returned in Q1 2025. My expected IRR on this investment from here remains compelling, and we continue to hold our shares as the fund is liquidated and capital returned.
GetBusy PLC – Core Value
GetBusy (OTCPK:GETBF) is our small-cap, UK listed productivity software business with a strong position in the tax and accountancy vertical, good economics and a net cash balance sheet. Similar to our investment in JZ Capital Partners, the management and the board of GetBusy have a clear strategy to sell assets in time and return the proceeds to us. Indeed, management have a private equity style incentive plan which is contingent on cash payments to shareholders of between £70mn and £150mn, likely from selling its US division, SmartVault. At the lower end of this range, shareholders would stand to make 2.3x the current share price and 4.5x the current share price at the upper end of the range, excluding any value for the remaining division.
Progress toward that goal is dependent on the ongoing growth of SmartVault from its current run rate revenue of c.$15mn to $25mn in time with steady economics and acquisition multiples for this business of between 4x and 8x revenue. As such, I am focused on the development of SmartVault and M&A activity in this space.
GetBusy reported H1 results in September. SmartVault revenues grew 8% at mid-80’s gross margins, which is a solid performance. SmartVault has integrations with every major professional tax preparation software used by accountants in the USA, which increases the stickiness of its customers and therefore the strategic value of the business.
There have also been three relevant transactions in the last year. Wolters Kluwer (OTCPK:WOLTF) acquired a similar workflow productivity software business focused on accountants in July for 9x revenue. A well known Private Equity sponsor in the space, Leonard Green, acquired a stake in IRIS which is a larger, but very comparable software firm for 10x revenue. Finally, Thomson Reuters (TRI) acquired SafeSend, another productivity software tool for accountants for 10x forward revenue. These transactions are a good indication of the arbitrage on offer here between public and private market valuations for these businesses. As the CEO of GetBusy put it in a recent release announcing a new integration with one of Intuit’s software products, “The GetBusy board is increasingly confident in SmartVault’s strategically valuable position in the US accounting market…and remains excited about the long-term shareholder value creation prospects for the business.”
Motorpoint Group PLC – Core Value
Motorpoint (OTCPK:MTPTF) is our UK listed small cap and the largest independent used car retailer in the UK. Motorpoint has the lowest unit costs in the industry which allows it to consistently offer lower prices on like for like product in an industry with a high degree of price comparability. This has resulted in steady market share gains in its segment at attractive returns on capital. The business is run by Mark Carpenter, who has most of his net worth invested in the shares of the company. We acquired our shares in Q1 of 2023 and the summary thesis on the investment is available here.
Motorpoint’s operating environment continues to improve. The company reported H1 results in November, which showed volume growth of 17% with increasing gross profit per unit and market share gains. Volume growth is coming back as supply of nearly new cars is improving, particularly as car rental companies refresh their fleets. Unlike the mom & pop used car dealers, Motorpoint is able to provide a ‘bulk buy’ solution for many of these companies, which allows them to source cars at a lower price than the mom & pops. About 80% of Motorpoint’s gross asset position is inventory (cars), and it turns that inventory over every 40 days so even on slim margins, it makes attractive returns on capital which enables it to open new branches while also returning the vast majority of profits back to shareholders. Indeed, I had constructive conversations with management during the year to encourage them to buy back shares at what remains a large discount to fair value. I was happy to see the Board authorise a share buy back of 4% of the shares outstanding, which has now been completed. They also announced a new store opening in Norwich, which is a sign of their confidence that the operating environment is improving following 2 years of tough trading post the COVID pandemic.
As always, I thank you for your trust and welcome your questions and comments.
Sincerely,
Desmond Kingsford
Appendix 1: Summary Thesis on our Investment in Fevertree Drinks PLC
Fevertree Drinks PLC is a Core Value investment for Highwood. Fevertree (FEVR) is the London listed beverages company best known for pioneering the premium mixer category under the tag line ‘if three quarters of your drink is the mixer, mix with the best’. FEVR was founded in the UK in 2004 by Charles Rolls, who was previously the head of Plymouth gin, and Tim Warrilow who remains the company’s CEO. Charles and Tim recognized that spirits brands were innovating to produce more premium, higher quality products but these spirits were still being combined with mixers using artificial sweeteners and preservatives. They launched Fevertree to give customers a better experience. FEVR’s mixers are made with the finest and most authentic natural ingredients available to pair with increasingly premium spirits. The business took off and within five years, Fevertree tonic water had overtaken Schweppes as the market leader in the UK. They built the brand through the On-Trade (Bars & Restaraunts), which allows them to establish a new, premium price point. That in turn drives category growth and delivers superior margins for all of FEVR’s customers throughout the value chain. The business has grown from just tonic to a wide range of mixers for all drinking occasions13, distribution has broadened to become 50/50 between the On-Trade and the Off-Trade (retail and liquor stores) and by geography. This is now a global beverages business with revenues split roughly equally between the UK, North America and Europe and is in a total of 90 markets around the world. In every market it has entered, Fever Tree has taken market share hand over fist and is now the market leader in Tonic and Ginger Beer in the UK, USA, Canada, Continental Europe, Australia and New Zealand. Consumers obviously love this product. Bars & restaurants also love it because it generates higher revenue and profit per serve. It also benefits retailers, who derive 7x more revenue per store from Fevertree than any other mixer. It has become a win-win for all members of the value chain and as is often the case, this has produced outstanding results for owners. Below is the annual revenue growth, margins and returns on capital this business has generated over the past 10 years.
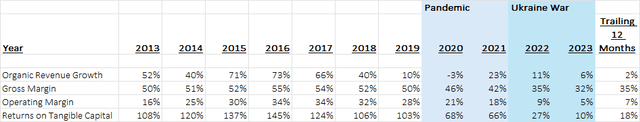
Prior to the pandemic, FEVR’s financials are the stuff dreams are made of. Revenue growth averaged 50% per annum, the vast majority of which came from volume growth, gross margins averaged 50%+, operating margins of 30%+ and returns on tangible capital over 100%. The stock was also a UK darling as you might imagine.
Then came the pandemic and the war in Ukraine. These two events caused significant logistics and cost issues for the business because it was fulfilling demand from its UK bottling facility. Transatlantic shipping costs went through the roof which took c.600bps off of Gross Margins. Then, gas prices promptly did the same when Russia invaded Ukraine. As gas is the largest input cost into making glass, and 80% of FEVR’s volume is sold in glass bottles, this took another 10% off gross margins. All the while, management took the view that these costs were transitory and so did not take prices in the US up to compensate for higher costs, partly because they did not want to sacrifice the price architecture in the US to pad the P&L in the short term, and partly because many of their US competitors had US bottling and so did not have the same issues.
Nonetheless, this is why profit margins went from 28% in 2019 to 5% in 2023. As you can imagine, the stock lost its ‘darling’ status in the process – it is down 75% over the past three years. The valuation as a multiple of revenue has fallen from c.8x pre pandemic to currently 1.8x revenue.
It is important to note that through this process, FEVR has continued to take market share in every major market and based on my research, the brand equity has only grown. Revenue in 2024 will end up around 370mn GBP, up 50% from 2020. Likewise, the business is debt free and has remained profitable and cash generative throughout these challenges.
Management are making the right moves to fix these logistics issues in my view. The US will be able to fulfill 100% of demand locally over the next year. This is a hedge to all of the aforementioned issues as well as any potential tariffs. In the shorter term, UK gas prices and transatlantic shipping rates have normalised. It takes two years for lower gas prices to feed through to lower glass prices given hedging programs, but it is happening, and that is why margins are now starting to improve. In 2024, they will recover 600bps of gross margin.
As production is moved to the US and logistics issues are resolved, I believe this business is capable of mid forties gross margins and low twenties operating margins as a stand-alone business. This is below what it did earn prior to the Pandemic despite increased scale. From the current price of 6.50/share, this would result in us owning a category leading, branded global drinks business with attractive ongoing growth prospects for 7 – 8x unlevered earnings. That is a steal and sets up prospective expected returns well in excess of our hurdle rate.
Moreover, I think we are likely to win even if management do not execute on solving these logistics issues. FEVR is an attractive asset for a range of larger beverages companies, all of whom could solve the logistics issues of local bottling with the stroke of a pen given their existing bottling contracts. They could also provide wider distribution of the product in less mature markets to accelerate FEVR’s growth. Coke & Pepsi would love to have a stronger position in adult soft drinks. The brewers are all suffering from low or declining volumes in mainstream beer and would like to diversify into growth categories. FEVR already has a partnership with Asahi in Asia. All the spirits companies benefit from having their products mixed with Fevertree14 rather than mainstream mixers. Transaction multiples for assets of this type that can be bolted onto an existing portfolio of brands are typically north of 6x revenue, which would imply a fair value for Fevertree if it was acquired of c. £20/share, or more than 3x the current price.
We have a strong margin of safety in a high quality business with well aligned management who own c.$100mn worth of stock. They are focused on avoiding the scenario where their life’s work is gobbled up by a larger beverages company.
Appendix 2: Review of the Investment Thesis for Borr Drilling
Borr Drilling is one of three special situation investments for Highwood. Borr makes money by contracting its rigs and crew to oil and gas developers for a specified day rate. Day rates for Borr’s rigs are a function of supply of all rigs available in the market and demand for drilling activity in shallow water.
My thesis on Borr has been that the supply of rigs available in the market is likely to remain flat or decline while demand for those rigs is growing, and likely to continue to grow. As a consequence, my thesis calls for jack-up rig rates to normalise from what were historically low rates to an equilibrium of at least $150- 175k/day, consistent with the long-term history of this market. At the mid-point of this range ($162,500 / day) with all of its rigs contracted, Borr will likely generate $500-600mn in free cash flow to equity holders vs a current market cap of $1bn including the convertible bond as equity, or a 50-60% free cash flow yield. At our original purchase price, this was closer to a 100% cash on cash yield, or 1x FCF.
On the downside, my thesis has been that Borr has the highest quality, youngest assets of any of the listed operators and we have a strong margin of safety compared to either the cash generation of these assets across a range of scenarios or their replacement value.
The chart below shows average day rates for jack-ups since from 2001 to 2024 in red. The blue dots are contracted rates for individual rigs.
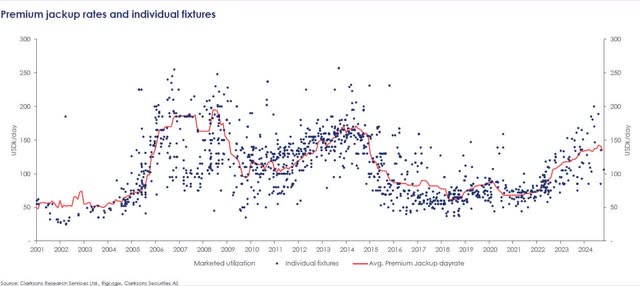
There are two points from this. Firstly, rig rates averaged $165k in 2014, bottomed at c.$60k in 2018 and have steadily improved from 2021 to a current average level of $135k. Rig rates have generally improved over the past 3yrs, in line with our thesis. Secondly, Borr has consistently contracted its rigs at a notable premium to the average – the blue dots above the line since 2023 have been contracts signed by Borr. The table below details the rig rates achieved on Borr’s own assets from 2023 in chronological order.
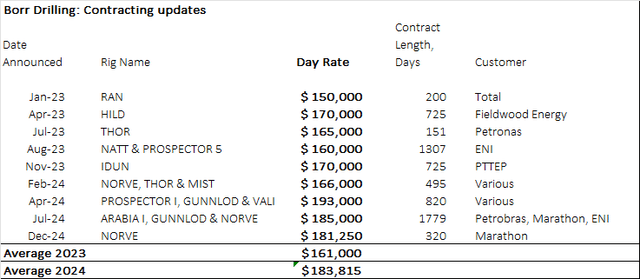
In 2023, Borr averaged new contract rates of $161k in vs the market average of c.$120k. In 2024, Borr averaged new contract rates of $183.8k vs a market average of $140k. In both years, the premium has been c.$40,000 per day for Borr’s rigs. I think this fact is indicative of the quality of these assets, which was part of the thesis as noted above.
So, rig rates have improved from when we bought the shares and Borr has consistently achieved premium rates. However, our shares in Borr were down in the year largely as a result of Saudi Aramco’s (ARMCO) decision in Q2 to suspend 22 drilling contracts with a range of suppliers including Shelf Drilling (OTCPK:SHLLF), ADES, Valaris (VAL) and two contracts with Borr. This follows Aramco’s decision earlier in the year to reduce its longer-term production target from 13mn bbls/day to 12mn bbls/day. The contract suspensions by Aramco drove near term earnings estimates downward across the industry and the price of shares with it. Valaris and Noble were down 37%, Borr 44% and Shelf Drilling 68% reflecting differing exposure to Aramco and differing capital structures.
Borr had 3 of its 24 rigs working for Aramco – Arabia I, Arabia II and Arabia III. The Arabia I was suspended in Q2. However, a few months later Borr re-contracted this rig to Petrobras at $185k/day. This was a 60% premium to what Aramco was paying. Hence, the suspension was in fact a net positive for us as shareholders as it is now more profitable than it was under the Aramco contract. Arabia II was suspended in November 2024 and we are awaiting news on it’s re-contracting.
Now, lets look forward. The question is whether day rates are likely to continue moving up to reach the equilibrium level called for in our investment thesis or not. Once again, this is a function of supply and demand for these assets. In the next section, I will touch on the outlook for the supply side, with reference to new build economics, and then finish with an outlook for demand.
What is compelling about this thesis to me, is the near axiomatic limitation on newly built competing rigs entering the market until day rates justify that investment. Until that day rate is reached, it is unlikely to see new competition in this market. My view is we are unlikely to see new rigs built until day rates are at least $175k/day, and possibly quite a bit higher.
The premise here is that for any rational provider of capital to put up $250-$300mn to have a new rig built, they would have to be confident they will earn an attractive risk-adjusted return on that capital. This premise has been the guiding principle over multiple cycles in this industry – often referred to as the capital cycle. New rigs are unlikely to be ordered if they generate a 7% return, as would be the case at today’s day rates, but they are likely to be ordered if they generate a 20% return.
The table below outlines the return on equity for a newly built rig at the current cost of c.$275mn per rig, where that rig is financed 50% with debt at the rate of 10% per annum, which is the current yield on secured rig bonds in the market, and what Borr is paying on its debt.
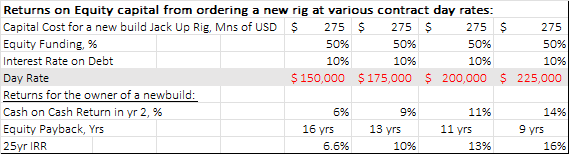
At day rates of $175k and below, the equity owner of a new build rig is earning less than a 9% cash on cash yield, a 10% long dated IRR and it takes at least 13yrs for the owner to get their equity check back. This is less attractive than what is available as a lender, which takes on lower risk. It would be hard for a capital owner to be excited about that prospect.
The second equally important implication of this is that if prices need to get to $175k/day before we face any new competition, what should we as owners of existing premium capacity expect to earn on our investment?
The table below gives some quantification around that question:
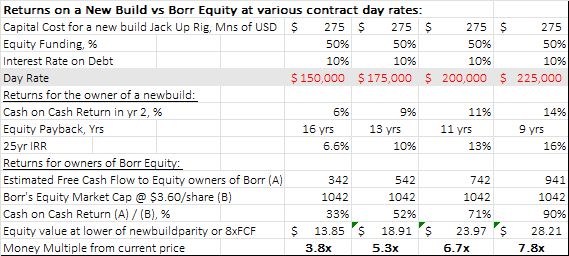
At day rates of $175k, Borr would be generating free cash flow of $500-600mn, which is a 50%+ cash on cash return for shareholders from current prices. The point here is that we should not see any new rig supply until Borr is earning at least $20mn – 25mn per rig annually or $500-600mn for all 24 rigs.
Another key premise is that capital is fungible between paying $275mn to order one new rig or (to keep the math simple) buying $275mn worth of shares in an existing rig owner. It would seem pretty silly to build one new rig for $275mnn when the same sum would buy you c.27.5% of Borr’s fleet of 24 rigs, or 6.6 rigs15.
That is the theory. Now let’s review how that matches up with history over the past 10 years. The current fleet of jack up rigs is 400 down from c.430 in 2014. This is the net effect of new rigs ordered before 2014 entering the pool and older rigs at the end of their useful life being scrapped, which takes them out of the pool. Roughly 100 rigs were delivered ‘into the pool’ over this time, all of which were ordered from 2011 to 2014 when rates for new rigs justified that investment at c.$175,000/day. At these rates, new capital was drawn into the market by theoretically attractive returns – a payback period of less than 11yrs as there was also more debt finance available at that time16.
Over the same 10-year period to 2024, c.150 older rigs in the fleet were scrapped, which more than offset the increased number of new rigs built. On average, these rigs were 38yrs old when they were scrapped – they were less capable than newer generation rigs, less safe and less comfortable. As a result, they attracted lower day rates and had higher running costs than newer models and in many cases were bank owned.
With these drivers in mind, lets consider the supply side over the next three years. The pool of jack up rigs available for contract is almost certain to decline further, and that rate of decline may accelerate. There are presently 12 rigs that will come to market in the next three years – this is the current orderbook across all rig builders. It is the lowest orderbook as a % of the existing fleet of jack ups since 2005.
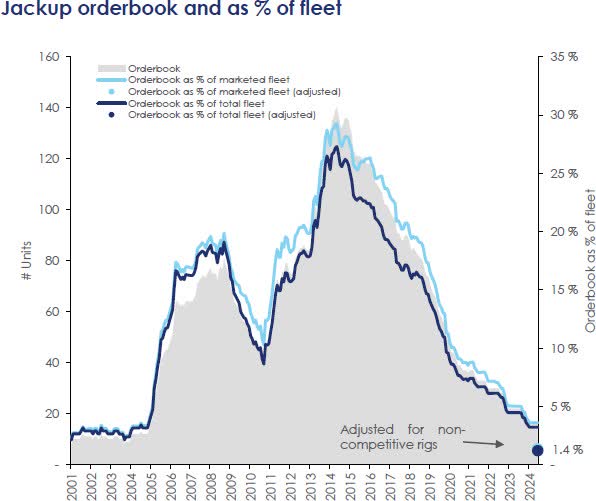
Against this, 130 rigs, roughly one third of the fleet are at least 40 years old. At today’s day rates some of these are being scrapped. So, to summarize, we have a new build day rate requirement of c.$175k before equity owners earn more than secured bond holders, 130 rigs over 40 yrs old and the lowest orderbook in 20 years.
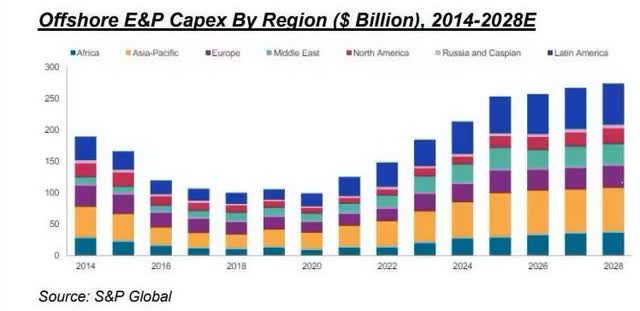
What about the demand side of the equation? Shallow water developments have a decline rate of 5-7% per annum, which necessitates new investment just to keep production and reserves stable. From 2014 to 2018, offshore E&P Capex declined below the level required to keep reserves stable. That changed in 2021 and offshore E&P Capex has been steadily poured back on to replace reserves and production. Since that time, offshore E&P capex has grown at a steady double-digit rate and in 2024 is growing at 15%. Within that, the middle east and Europe have been relatively stable while Africa, Asia-Pacific and Latin America are seeing strong growth.
In summary, I am confident the thesis remains sound. Supply is likely to remain muted or decline, and demand continues to grow even if there are speed bumps along the way and regional differences. With management having more information than me on prospective day rates and a keen eye on the share price given their close alignment as investors themselves, it should come as no surprise that they have been buying shares personally. The founder and Chairman of the company bought a further 1.5mn shares at
$3.93 in November, taking his stake to 17.7mn shares, or $65mn invested. The company also took action by switching the cash dividend to a share buyback which netted 4.7mn shares in November and December, equivalent to 2% of the shares outstanding. I continue to see a clear path to $500 – 600mn in free cash flow per annum versus the current market cap (including the convertible bond as equity) of $1bn, or a 50% – 60% free cash flow yield from current prices.
Appendix 3: Underlying Currency Exposure Split
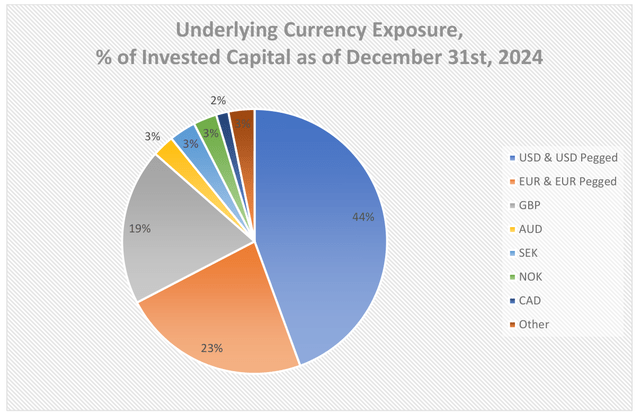
This is not a breakdown of the listing currency of our holdings. It is the split of the currencies our portfolio companies earn their revenues in. As such, it is the underlying exposure to currencies you have through your partial ownership of these businesses. As investors can choose whether to have their account in USD or CAD and hence their cash balance may be in either USD or CAD, I have expressed the currency exposure as a percent of invested capital.
|
Footnotes 1Returns presented are those of the Highwood Value Partners Client Composite, net of all fees and taxes in CAD. Past performance is not a guarantee of future results. Individual client returns will vary. Please see the disclosures at the end of this letter. 2Total Return since December 9 th, 2019 in CAD. 3Versus CAD. 4Apple, Microsoft, Alphabet (Google), Meta, Amazon, Tesla and Nvidia. 5Median, ex JZCP 6Only Protector, Ryanair and Motorpoint are exclusively ‘European’ businesses. 7Capital has been spent on a 440,0 sq ft distribution center in Phoenix, a new fulfillment center in Georgia and New Jersey and expanded fulfillment in the UK, Sweden, Canada, Italy and Norway. 8‘Developed Markets’ would add Australia, Canada, Israel, Japan, New Zealand, Singapore and the USA to the current mandate. 9In USD. 10This excludes YPF of course which remains unrealized. 11In USD. 12Ryanair’s return on capital in the ten years prior to the COVID-19 pandemic was 22.4% and has averaged 26.2% since the pandemic. 13As of June 2024, 42% of revenue was from the ‘Non-Tonic’ portfolio of drinks such as Ginger Beer and flavoured sodas and 58% was from tonic water in various forms. 14For example, In-flight sales of Tanqueray doubled when EasyJet switched from offering Schweppes to Fevertree tonic water. 15This is on an equity basis. Current share price of $3.60 x 290mn shares out including the convertible bond = Market cap of c.$1bn. On an EV basis, $275mn would buy you 2.5 rigs through Borr vs one new build. 16Now, we have higher finance costs, less financing available and higher labour costs than in 2014. Disclosures: This letter (“Letter”) provides a general description of Highwood Value Partners, Inc. (the “Firm”). The Firm is registered with the British Columbia Securities Commission, the Alberta Securities Commission and the Ontario Securities Commission (the “Commissions”) as a portfolio manager under National instrument 31-103 – Registration Requirements, Exemptions and Ongoing Registration Obligations(“NI 31-103”). Desmond Kingsford, the principal of the Firm, is registered as the advising representative of the Firm under NI 31-103 with the Commissions. The information presented in this Letter is not investment advice, should not be relied on as such, and should not be viewed as an investment recommendation by the Firm or Mr. Kingsford generally, or an offer or a solicitation of an offer for the purchase of any securities. Recipients should not make any investment decisions based on the information contained in this Letter. Only (i) an “accredited investor” as defined under section 1.1 of National Instrument 45-106 – Prospectus Exemptions; and (ii) a “permitted client” as defined under section 1.1 of NI 31-103 may invest with the Firm. This Letter is presented solely to illustrate the Firm’s investment process and strategies as of the date indicated on the cover page of this Letter and is based on information provided by management of the Firm as of such date and on beliefs, assumptions, expectations and/or opinions of management as of such date. Certain information contained in this Letter may have been obtained by management of the Firm from third parties and, although believed to be reliable, has not been independently verified and its accuracy, timeliness or completeness cannot be guaranteed. While the Firm’s investment mandate is designed to reduce risk the program will inherently entail substantial risks. There can be no assurance that the investment objective of the Firm will be achieved. In fact, the investment techniques that the Firm may employ from time to time may, in certain circumstances, substantially increase the adverse impact on the Firm’s investment portfolio. Accordingly, the Firm’s activities could result in substantial losses under certain circumstances. A separately managed account managed by the Firm is highly speculative and there can be no assurance that the investment objectives of the Firm will be achieved. Nothing herein is intended to imply that the Firm’s investment methodologies may be considered “conservative”, “safe”, “risk free” or “risk averse”. Investors must be prepared to bear the risk of a total loss of their invested capital. Past performance of Mr. Kingsford and his affiliates is not necessarily indicative of the future results and any prospective clients of the Firm will need to be prepared to lose all or substantially all of their investment. The Firm will give no warranty as to the performance or profitability of any client account or that the investment objectives of a client’s account will be successfully accomplished. Certain statements contained in this Letter may be considered “forward-looking information” and “forward-looking statements” (collectively “forward-looking statements”) within the meaning of applicable Canadian securities legislation. All statements, other than statements of historical fact included herein, without limitation, statements relating to the Firm’s future financial performance and investment returns, are forward-looking statements. Forward-looking statements are frequently, but not always, identified by words such as “expects”, “anticipates”, “believes”, “intends”, “estimates”, “potential”, “possible”, and similar expressions, or statements that events, conditions, or results “will”, “may”, “could”, or “should” occur or be achieved. Forward-looking statements in this Letter include, among other things, statements relating to: the desire to generate outstanding investment results with low risk; the proposed timeline for the Firm’s investment horizon and Mr. Kingsford’s career; the benefits of operating the Firm out of Whistler, British Columbia as opposed to a more traditional investment market; Mr. Kingsford’s beliefs regarding the necessary components to investment success; the future operating or financial performance of the Firm and the assets managed by the Firm; the intention to prioritize long-term investment return over short-term results; the intention to take on more capital only where the Firm believes it will not dilute investor returns; the intention to maintain a fee structure that incentivizes manager performance over asset gathering; the intention to maintain the Firm’s current strategy and vision as it grows; the potential to provide a fund structure in addition to the SMA approach in the future; the Firm’s mission to compound each dollar of invested capital into five dollars over a ten-year period without taking undue risk; the belief that a short term quarterly or annual results focus is harmful to long-term returns; the Firm’s beliefs with respect to how risk is properly defined and mitigated; the Firm’s beliefs as to how returns may actualize; the beliefs of the Firm and Mr. Kingsford regarding the prospective results of specific investments of the Firm; the theories and beliefs disclosed regarding what makes an investment strategy successful; and the expectation and plans for growth . Actual future results may differ materially. There can be no assurance that such statements will prove to be accurate, and actual results and future events could differ materially from those anticipated in such statements. Forward-looking statements reflect the beliefs, opinions and projections on the date of this Letter and are based upon a number of assumptions and estimates that, while considered reasonable by the Firm and Mr. Kingsford, are inherently subject to significant business, economic, competitive, political and social uncertainties, many of which are beyond the control of management. Many factors, both known and unknown, could cause actual results, performance or achievements to be materially different from the results, performance or achievements that are or may be expressed or implied by such forward-looking statements and management of the Firm have made assumptions and estimates based on or related to many of these factors. Readers should not place undue reliance on the forward-looking statements and information contained in this Letter concerning these assumptions. None of the Firm or Mr. Kingsford or their respective affiliates, associates, shareholders, directors, officers, employees, agents or representatives (collectively, the “Representatives”), as applicable, makes any representation or warranty, express or implied, as to the accuracy or completeness of the information contained herein or any other information (whether communicated in written or oral form) transmitted or made available to recipients, and the Representatives expressly disclaim any and all liability relating to or resulting from the use of this Letter or such other information by a recipient or any of its affiliates, associates or representatives. The Representatives will not be liable for any errors (as a result of negligence or otherwise, to the fullest extent permitted by law in the absence of fraud) in the information, beliefs, assumptions, expectations and/or opinions included in this Letter, or, as noted above, for the consequences of relying on such information, beliefs, assumptions, expectations and/or opinions and further the Representatives disclaim any obligation or undertaking to provide any updates or revisions to any information contained herein to reflect any change in beliefs, opinions, expectations, assumptions or estimates with respect thereto or any change in events, conditions or circumstances on which any statement in this Letter is based. The Highwood Value Partners Client Composite (“The Composite”) is the asset-weighted return of all Client Accounts managed by the Firm according to Highwood’s Investment Mandate and meet the inclusion criteria of the composite. Highwood’s Investment Mandate is fundamental value investing with an opportunistic, concentrated and long-term approach, focused on International public equities. For inclusion in the Composite client accounts must have a net asset value of at least $100,000 CAD and be managed with full discretion. Client accounts meeting these requirements are included in the Composite after the first full month of discretionary management. The Composite returns are stated after all fees paid to Highwood, withholding taxes, transaction expenses and sales taxes in Canadian Dollars. The Firm’s chosen benchmark index is the MSCI Europe SMID Cap Index in Canadian dollars. This is the market capitalisation weighted index of 1,110 European companies with market capitalisations from $35bn USD to $100mn across 15 developed countries in Europe. Where the Firm references the performance of this index, it is expressed as total return (ie including dividends), net of fees in Canadian Dollars. Full details of the methodology used by MSCI in the calculation of returns of this index is available here. |
Original Post
Editor’s Note: The summary bullets for this article were chosen by Seeking Alpha editors.
Editor’s Note: This article discusses one or more securities that do not trade on a major U.S. exchange. Please be aware of the risks associated with these stocks.
#Highwood #Partners #Letter #Investors