Thomas Barwick/DigitalVision via Getty Images
Rising Uncertainty Leads to Greater Long-Term Opportunity
2025 has been a bit of a roller coaster. The year started strongly, with the market making new highs in mid-February, followed by a double-digit drawdown into quarter end. Sentiment quickly turned lower on rising economic uncertainty as the administration moved towards rolling out global tariffs. Marketplace fears are rising, discounting slower future economic growth and a potential second wave of inflationary pressures caused by tariff implementation. Corporate leaders have also highlighted the recent rise in uncertainty. Nearly half of the S&P 1500 companies mentioned tariffs during their recent earnings calls, up 233% from the prior quarter.
Shortly after the fifth anniversary of the global Covid outbreak, the U.S. Economic Policy Uncertainty Index1 quickly approached 2020 peak levels (the only two occurrences above 400 over the past 40 years). Current policy uncertainty levels are more than 50% higher than the U.S. debt downgrade during August of 2011. As we have seen in the past, equity prices, which discount future expectations, dislike rapidly rising levels of uncertainty. It is no surprise that investors have sought out “safe haven” money market funds, which are at new record levels at greater than $7T and up more than 16% over the past year.
US policy uncertainty index
Source: policyuncertainty.com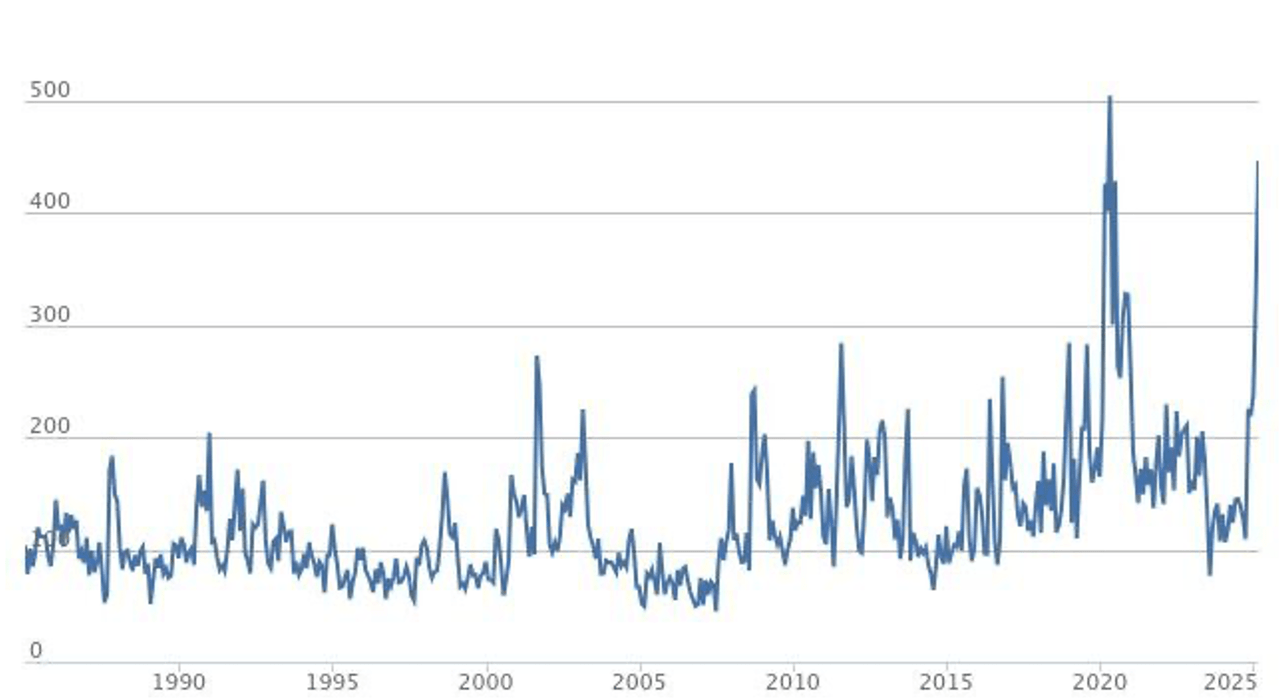
Price volatility is often a welcome occurrence to long-term oriented value investors. Volatility is not risk; permanent capital loss is the main risk for investors. With equity prices representing ownership pieces of an underlying business, a sharp fall in market prices can create very attractive long-term investment opportunity. The greater the market price discount to the business’s long-term fundamental value, the more attractive the investment opportunity.
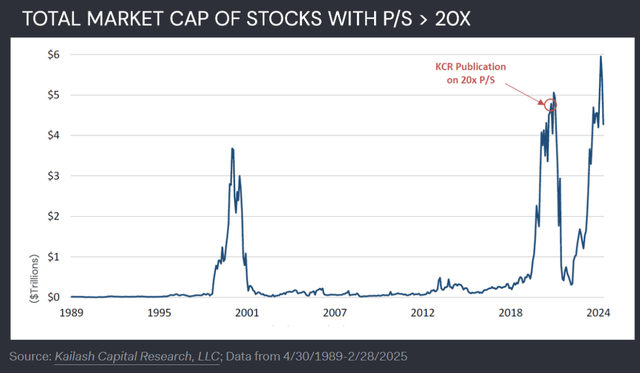
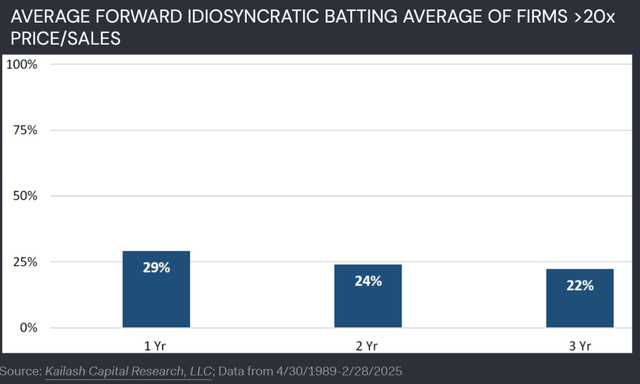
While we view the recent drawdown as an attractive opportunity, we still see risk in the longest duration equities which fueled periods of marketplace speculation over the past couple of years. History has also shown that market corrections help to remove these market excesses. The most expensive subset still made up a significant portion of the market and have embedded market expectations for significant growth into the future along with very high valuation multiples. During the quarter, the total market cap of stocks with price-to-sales greater than 20x reached an all-time high $6T! That’s $1T higher than 2022’s peak and is nearly 2x the Dot Com peak! As Kailash Capital recently highlighted, one has had two times better odds at a casino than having success investing in stocks with valuation multiples over 20x sales over the long term.
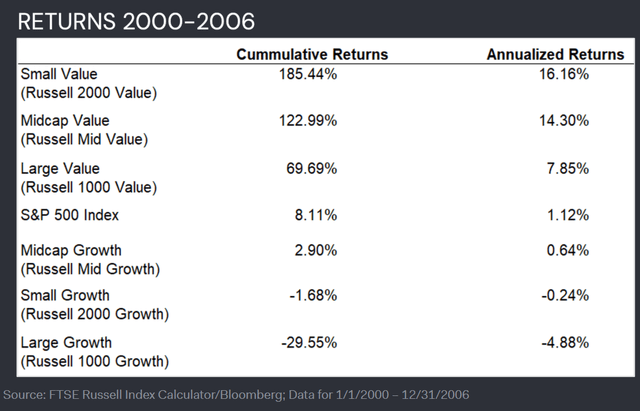
History has shown that the most expensive portion of the market has consistently lagged the overall market returns over the long term. Is there a lesson from the 2000 and 2022 time periods? Overlooked low valuation stocks had market leading returns coming out of these peak speculation time periods. From 2000 to 2006, Small-Cap Value and Mid-Cap Value led the market, significantly outperforming Large Cap Growth by 150-215%!
As we highlighted in our recent quarterly letters, lower valuation securities continue to have lower representation in passive Indexes; they are under-owned and under-followed by the marketplace. Greater volatility and wider valuation spreads further enhances the potential for attractive future investment returns. There are an increasing number of companies in the market today, trading at a single-digit price-to-earnings multiple. Today, the lowest valuation subset is close to a 20% earnings yield, which is five times higher than the 10-year bond and nearly four times higher than the overall market.
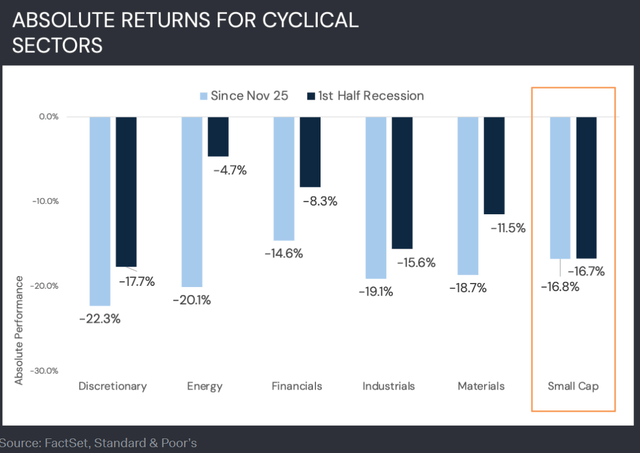
The uncertain environment has also caused the marketplace to increase its probability of a recession taking place during 2025. While it’s possible that lower business and consumer confidence leads to a recession, we would expect a shallow and short one being more likely rather than a deep and prolonged recession. In fact, the current drawdown for small cap cyclicals from November 25th highs is greater than the average drawdown seen during the first six months of a recession. The black bars in the chart highlight the average recession drawdown in the first 6 months, looking back 100 years.
Miller Deep Value Select Strategy Composite Returns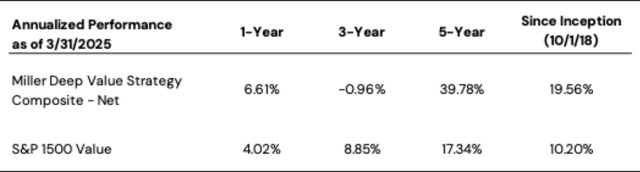 Past Performance is no guarantee of future returns. The Miller Deep Value Select strategy incepted 10/1/2018. Performance periods greater than one year are annualized. The “gross” of fees performance figures reflect the day-weighted performance of assets (including cash reserves) managed for the period and do not reflect the deduction of our investment management fees or performance fees but do reflect the deduction of trading commissions and withholding taxes. Throughout this document, the “net” of fees performance figures reflect the deduction of trading commissions; withholding taxes; the reinvestment of dividends, interest and other cash flows; a model performance fee; and a model investment management fee equal to the maximums under our fee schedule for Deep Value Select separate accounts. The following is our fee schedule for new Deep Value Select strategy separate accounts (as reflected above): the model performance fee is 20% of the account’s performance, after the investment management fee has been deducted, above a 6% hurdle rate; the model investment management fee is 1.00% on all assets under management. These model fees have been deducted from the gross returns on a monthly pro-rated basis to arrive at the net of fee performance shown above. Historical separate account investors may have paid lower fees than the model fees used to calculate “net” of fees performance here. The model performance fee is calculated and accrued on a monthly basis and paid out annually. For important performance information, please reference the Deep Value Select GIPS Composite Disclosure. |
During the quarter, the Deep Value Select strategy had a -12.8% drawdown, lagging the S&P 1500 Value Index -.2% and the S&P 600 Value Index -9.9%. After reaching an intra-quarter peak, the strategy had a greater than -15% drawdown. Looking back, since the strategy inception, a 15%+ drawdown was a rare occurrence. The seven other occurrences lasted one to four months and all saw a positive performance recovery, looking out to 6 months and 1 year. Average 6-month returns from the trough were +36.16% and 1-year average returns were +90.77%.
During the quarter, the strategy’s largest positive contributor was Gray Media (GTN), with shares up +37%. Gray significantly lagged the strategy during the back half of 2024. While the company’s political advertising led the overall market, it fell below market expectations. Gray continues to generate strong free cash flow and successfully paid down more than $500M of debt during the past year. While the company has significant debt leverage, Gray has a much smaller amount of debt maturities over the next two years. Marketplace expectations for Gray’s future retransmission revenues remain very low, providing a nice ongoing variant as management focuses on improving long-term retransmission agreements. Near-term risks include an advertising recession; auto advertising may be weaker over the coming months; however, local advertising has so far remained resilient. Gray has the potential to deliver strong free cashflow next year and $2B+ over the coming 5 to 6 years. Ongoing debt reduction should accrue to the equity over time. We see long-term upside potential multiples of the current share price.
Our two largest detractors during the quarter were Gannett (GCI) and Nabors Industries (NBR), with shares down 43% and 26%, respectively, during the quarter. Both companies’ share prices are at deep discounts to our view of their long-term fundamental value, and we have recently increased position sizes in both holdings.
Gannett has had ongoing success with its long-term transformation to a digital media company. Digital revenues (subscriptions, advertising, media services, partnerships, and e-commerce) are expected to become half of Gannett’s revenue later this year as the company focuses on monetizing its 200M monthly audience reach. The secular headwinds of the traditional newspaper business remain as the most obvious near-term risk. While this portion of the business may continue to decline, Gannett has ongoing cost reduction opportunities to drive greater operating efficiencies. Gannett shares remain significantly mispriced in our opinion at only .17x revenue and >50% normalized free cash flow yield. New York Times (NYT), which went through a similar digital transformation ten years ago, has a much higher valuation level, with price to sales at 3x and Enterprise Value to EBITDA (“EV/EBITDA”) greater than 15x. In addition, Gannett’s anti-trust suit versus Google is very similar to the DOJ anti-trust suit against the company. Kellogg Hansen, a firm that specializes in anti-trust cases, with successful historical awards and appeals of more than $1B, is representing Gannett. The law firm agreed to success-based compensation for their services. Winning the anti-trust case would accelerate Gannett’s transformation and accrue significant value to shareholders. We believe the current share price reflects limited value for the long-term prospects of the transformation plan and the significant chance of prevailing in the anti-trust case.
Nabors recently completed the acquisition of Parker Drilling. The transaction is accretive to free cash flow per share. Parker provides Nabors greater access to the growing lateral drilling marketplace. In addition, the transaction will significantly increase Nabors Drilling Solution (“NDS”) segment, which has market-leading technology and strong global growth opportunities. With very low capital intensity and high free cash flow conversion, Nabors NDS segment should support accelerating future free cash flow generation. While there is ongoing near-term risk on weaker than expected domestic and international drilling expenditures, we see these risks significantly discounted in the current share price. While there is also potential integration risk with doing an acquisition, the Parker Drilling transaction provides significant margin of safety in our opinion (attractive cost savings, balance sheet benefits, potential non-core asset sales and accelerating free cash flow generation). Nabors share price looks extremely attractive, below one times cash flow (approaching their Covid 2020 all-time lows). At a greater than 50% normalized free cash flow yield and EV/EBITDA (2025) below 3x, we see long-term upside potential multiples of the current share price.
During the quarter, we made a new investment in an attractively priced building supplier. JELD-WEN (JELD) is a leading North American and European manufacturer and distributor of interior and exterior doors and windows to new construction and remodeling sectors. JELD-WEN share price has been under significant pressure, 73% below its 52-week high as the company has experienced revenue and profit weakness. The company is undertaking a multi-year transformation, bringing in automation and system enhancements to enhance their manufacturing and warehouse footprint. Since 2023, new senior management has removed $350M from their cost structure and management expects $100M/year in further productivity savings. As they rationalize their infrastructure over the next five years there is significant capital efficiency improvement potential. In addition, like our investments in Quad Graphics (QUAD) and United Natural Foods (UNFI), JELD-WEN owns real estate, which provides a significant margin of safety for the transformation plan. While the company expects margins and profits at historical trough levels in the early part of 2025, a new cost reduction program should support margin and profit improvement later in the year. Near-term risk is a weaker housing and remodeling marketplace, causing greater near-term revenue weakness and a slower recovery in company margins. Long-term positive supply and demand dynamics (favorable demographics and limited supply) should shorten the current downturn. In addition, there was a recent market transaction that bolsters our view JELD-WEN’s significant embedded value proposition. Owens Corning acquired Masonite International (interior/exterior doors) in May 2024 at 8.6x EV/EBITDA. JELD-WEN should be a beneficiary of any housing recovery, with 25-30% incremental margins on a future volume improvement. Long-term upside potential from their transformation plan supports the goal of achieving double digit normalized EBITDA margins and could realistically support a share price multiples the current price level.
While Deep Value Select experiences monthly volatility of returns, these are not capital impairments as there have only been a small handful of occurrences where we have sold an investment for a loss. We have recycled capital from mostly successful historical investments into new investments or holdings that have lagged the strategy historical returns. Strategy portfolio measures today are approaching historical extreme levels. On average, the strategy’s holdings ended the quarter 42% below their recent 52-week high, which is close to the historical average performance trough for Strategy holdings. Deep Value Select valuation measurers are also approaching historical lows, on average at less than 1.5x cash flow, price to sales less than .2x and normalized earnings and free cash flow greater than 30%. We thank our clients for their patience during these drawdown time periods. We see significant return potential in the strategy holdings today and remain steadfast in our investment approach, focused on delivering attractive long-term returns.
Dan Lysik, CFA
|
1The US Policy Uncertainty Index measures policy-related economic uncertainty using three underlying components: news coverage, federal tax code provisions, and the Federal Reserve’s Survey of Professional Forescasters. For more information, please visit policyuncertainty.com. References to specific securities are for illustrative purposes only. Portfolio composition is shown as of a point in time and is subject to change without notice. Contributors and Detractors mentioned above are those holdings that had the greatest effect on the Strategy’s composite performance for the quarter. For information on how Contributor/Detractor data are calculated and their effect on composite performance, contact us. For more information about Miller Value management fees, please contact us. Past performance cannot predict future results. It is not possible to invest directly in an index. Unmanaged index returns do not reflect any fees, expenses, or sales charges. The Russell 1000® Growth Index measures the performance of those Russell 1000 Index companies with higher price-to-book ratios and higher forecasted growth values. The Russell 1000® Value Index measures the performance of those Russell 1000 Index companies with lower price-to-book ratios and lower forecasted growth values. The Russell 2000® Value Index measures the performance of the small cap value segment of the US equity universe. The Russell 2000® Growth Index measures the performance of the small cap growth segment of the US equity universe. The Russell Midcap® Value Index measures the performance of the mid- cap value segment of the US equity universe. The Russell Midcap® Growth Index measures the performance of the mid- cap growth segment of the US equity universe. Batting average is a statistical method that measures an investment manager’s ability to meet or beat the returns of a benchmark index. Price-to-Sales (P/S) is a valuation metric that compares a company’s market capitalization to its total revenue, indicating how much investors are willing to pay for each dollar of sales. CRSP US Large Cap Index includes U.S. companies that comprise the top 85% of investable market capitalization. CRSP US Mid Cap Index targets U.S. companies that fall between the top 70% – 85% of investable market capitalization. CRSP US Small Cap Index targets inclusion of the US companies that fall between the top 85% and 98% of investable equity market capitalization. The S&P 1500 Index includes stocks in the S&P 500, S&P 400, and S&P 600 and covers approximately 90% of the market capitalization of U.S. stocks. Price to earnings is the market price per share divided by earnings per share. Earnings Yield is a valuation metric that refers to the earnings per share for the most recent 12-month period divided by the current price per share. The S&P 1500 Value Index draws constituents from the S&P 1500 Index. Value is measured on three factors: the ratios of book value, earnings, and sales to price. The S&P 600 SmallCap Value Index tracks the value stocks in the S&P 600 SmallCap Index, identified by three factors: book value, earnings and sales to price. An investor cannot invest directly in an index. Free cash flow is earnings before depreciation, amortization, and non-cash charges minus maintenance capital expenditures. Free cash flow yield is an overall return evaluation ratio of a stock, which standardizes the free cash flow per share a company is expected to earn against its market price per share. The ratio is calculated by taking the free cash flow per share divided by the share price. Enterprise Value to Earnings Before Income, Taxes, Depreciation, and Amortization (EV/EBITDA) is the enterprise multiple and is used to determine the value of a company. EBITDA is earnings before interest, taxes, depreciation and amortization and is a calculation of a company’s financial health. Any views expressed are subject to change at any time, and Miller Value Partners disclaims any responsibility to update such views. The information presented should not be considered a recommendation to purchase or sell any security and should not be relied upon as investment advice. It should not be assumed that any purchase or sale decisions will be profitable or will equal the performance of any security mentioned. Past performance is no guarantee of future results, and there is no guarantee dividends will be paid or continued. ©2025 Miller Value Partners, LLC |
Original Post
Editor’s Note: The summary bullets for this article were chosen by Seeking Alpha editors.
#Miller #Deep #Select #Strategy #Letter